click on images above to enlarge
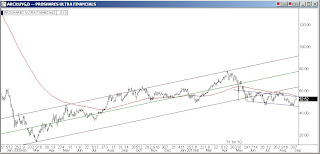
Today the markets pulled back as the big short squeeze ended. The reason behind the pullback lies in the chart of the financials. I added an extra chart tonight, the UYG Financials ETF. It is the largest ETF that tracks the Mega Banks. One constant through the decades has been that every rally in the stock market will end up failing if the big financials are not participating. They are a necessary player in every major leg up. This chart of the big financials shows how they have been contained by the blue line downhill channel. Until we break out of this channel and successfully retest push up from the top side of it, all rallys will likely end when the financials reach the upper channel line. This is the chart that must break out succesfully for us to begin a new leg up in the market.
Looking at the middle cluster of charts, we see that todays sharp trend reversal earned the #1 or smallest sell signal line.
Looking at the lowest chart cluster we see, in row 1 chart 3 we see that the S&P hit doulble overhead resistance today when it came up against the brown 100 ma line and the purple 250 ma line. In chart 4 of row one we see that we slipped back down out of the brown line mother channel and also fell back down below the 108 ema line. This is the unique pivot point I mentioned a couple of nights ago.
In row 2 of the lower cluster we see that the S&P slipped back down into the 5 week downhill brown line channel.
In Row 3, chart 2 - the 30 min bar chart, we see that the red 5 line is going to meet the pink 50 line tomorrow, an intraday pivot. In chart 3 of row 3 we see that the advance/decline is back down into the buy area somewhat.
Today's market action is quite reasonable after a 3 day vertical move. Now the ground campaign must show us what it's got. We will see...
Alan


