Stock Market Technical Analysis Blog
click on above image to enlarge
In the above chart set the bonds have finally broken down thru the pink Day 50 EMA line on the European agreement news.
click on above image to enlarge
In the above chart set the NASDAQ is approaching its upper 3-month channel line as the TLT is at its lower 4-month downtrend line.
click on above image to enlarge
In the above charts the SPY and DOW are doing most of the work the past few days as they still have plenty of room left in their uphill blue channel.
click on above image to enlarge
In the above charts we see a breakdown in the VIX today and the dollar returning to trading in its longterm slightly downhill channel.
click on above image to enlarge
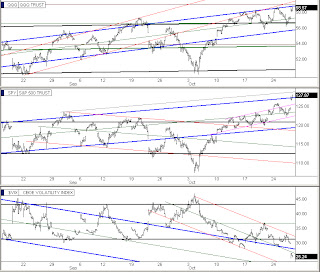
In the above chart the most noteworthy item is that the QQQ has reached its upper blue channel line which has been quite restrictive the past two weeks.
click on above image to enlarge
In the above charts the Advance Decline has just pegged the upper red line showing extremely short term overbought.
click on image to enlarge
In the above chart set we see that today is a big day for the DOW and S&P as they both have re-entered their mid-year horizontal black line channels. The TLT, UUP, and VIX are all three at the lower line of their downhill channels at this hour. Most noteworthy is the VIX which is also catching support at the lower line of its longterm, slightly uphill, black line channel.
click on image to enlarge
In the above set we see that the right side monthly bars charts have their fall rally lift well under way now.
Alan
Please see risk disclaimer below


