Stock Market Technical Analysis Blog
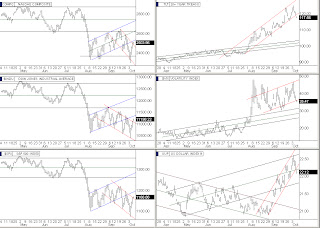
Click on above images to enlarge
This morning the major indexes broke out of their respective channels as shown in the bottom chart. After popping then selling back down on better job numbers premarket the market is now trading flat as traders are now eyeing two situations. The first, the TLT (bond ETF) has just set down on its blue 20 EMA line as can be seen in the top chart set (bonds bounced vigorously up from the same line back at the first of September). Looking at the fifth chart set the QQQ is right up against the lower line of its uphill red line channel plus the SPY has run up against the underside of is corresponding channel. In the third chart set the VIX is quickly approaching its 50 day EMA line shown in pink. All these put together, the market may end up spending the day digesting where we are at especially seeing the bonds at their 20 EMA line right now. Very few traders will want to open a new position either way until Monday since we didn't get any real follow through yet on the short term channel breakouts shown in the bottom chart.
Alan
Please see risk disclaimer below


