click on images to enlarge
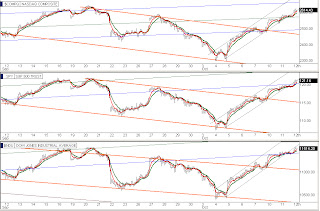
At the premarket open the SPY was jammed much higher sending the bonds downward sharply. In the chart set above, the top Stock funds chart we see that today's open gapped up across the light gray resistance line I drew in. My bonds to stocks switch I made last Wednesday morning with a green line onto stocks chart and red line onto bonds chart is having its seventh day of good gains. As for the bonds fund charts we see the big gap down this morning after trading sideways for two days. At this moment the bond's gold 5 EMA is touching the blue 20 EMA but the likeliness of the bond bulls turning the bonds back up here has been greatly diminished because of the stocks breaking above that light gray resistance line in the chart above it.
click on images to enlarge
In the chart set above, the stock gap up put it back up into its blue ascension channel and the bonds back down into their descending blue channel.
In the chart set above, the NASDAQ is well on its way in its midterm blue channel as the SPY and the DOW have regained the bottom side of their blue channels.
In the chart set above, the dollar could get a bounce off of its lower gray channel line, the TLT bond funds have dropped barely down into their descending gray channel and the VIX is falling convincingly back down into its gray descending channel.
In the chart set above, we see the significance of the both the bonds and stocks stalling the past two days as we have been at or near major channel lines on the QQQ, SPY, and VIX. With this morning's gap up the QQQ and SPY broke out of their 10-week horizontal black line channels and the VIX has dropped out of its 10-week horizontal black line channel. The transition in these charts from yesterday to today is significant.
In the chart set above we see the Advance Decline is starting to get into the rafters so this intraday push is likely to be close to done for at least a couple of hours.
In the chart set above we see the NASDAQ right now has reached the bottom channel line of its horizontal March thru July black line trading channel. In the S&P 500 chart it broke a significant downtrend line shown with a pink line. The DOW chart below it shows us sitting down onto the lower blue channel line yesterday and pushing up from it today. In the TLT 20-year treasury we see the significance of the transition from yesterday to today as the TLT bonds ETF dropped out of its horizontal blue channel that it has been trying to establish for the past two days. In the UUP dollar index once again a major development as it dropped out of its 5-month uphill black line channel. In the VIX volatility index chart this morning we dropped back into the modestly inclined black line channel that we broke up out of in the first week of August causing 10-weeks of stock market ugliness.
In the chart set above the quarterly and monthly bars charts of the indexes we see the fall rally setup they are working to begin as I discussed on my blog on Monday evening's blog. Right now the only thing hindering the PPT's plan for the fall stock rally is just simply that the NASDAQ going a little higher to get back up into its MAY thru July horizontal channel that can be seen in chart set 7.
Alan
Please see risk disclaimer below


