Stock Market Technical Analysis
Click on above image to enlarge
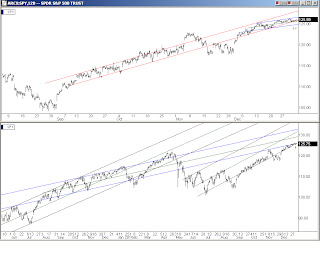
I hope everyone enjoyed the holidays and is ready for a big trading year. I posted 2 charts above, the top is a 2 hour bars chart of SPY/S&P and the lower is a daily bars of the same. In the lower daily chart, the blue channel is the first channel we established at the first bottom of financial crash 2 years ago. The black channel came a couple of months later when the market fell a little deeper to the true bottom. The brown channel is the 6 month run up to improve the 30 yr yearly bars chart of the S&P that I've have talked about before. As you can see, we are approaching a juncture where Monday or Tuesday's trading will either have the brown channel restore our position into the blue channel for a good January or the blue channel will push us down out of the brown channel.
In the upper chart, the inner core channel is shown in red and the three week leveling out channel is in blue . As everyone knows, we had a wicked selloff in the last hour on both Thur and Fri. Thursday's dip was dragged back up Friday morning and Friday's dip was met with a powerful automated buying program that popped the market back up in the last 10min Friday. The intensity of the 2 quick sell-offs shows how important the lower line of the red core channel is. If you look closely you can see the dip on both days dropped below the red line ,as we also dropped below the lower line of brown 6 month channel in the lower chart.
It's pretty much universally expected the market will roar next week and take us on up to trading in the blue channel. This really must happen as the charts show because there are powerful automated sell programs positioned on the lower line of the red core channel as we saw their effect late Thur & Fri. With any luck the market will meet everyones expectations and have us off to a good start for the new year.
Alan


