Stock Market Viewpoint

Stock Market Viewpoint
Reading the Tea Leaves...

Wednesday, July 31, 2013

Bernanke Completes Moonwalk Away From Taper Speech

Stock Market Technical Analysis Blog


Click on image to enlarge

In the market today we have the Fed policy statement without mention of tapering in September or at any time which gave the market a brief rally in the late afternoon but gave it all back into the bell. While the worries of Fed tapering are on the backburner for the foreseeable future, the market is still wrestling with being up so much in the last 6 months and the immediate situation of the VIX and the S&P being so close to their 15 EMA lines shown in blue in the two charts at the top. Today's bar on the S&P ended as a shooting star from the post speech rally then the pullback. The VIX did the opposite, dropping hard at the speech then coming back up at the bell for an upward biased hammer candle. The closing number on the VIX was once again just below the blue 15 EMA line and the closing number on the S&P was just a little above its 15 EMA line.  As long as the VIX doesn't close above the line and the S&P doesn't close below its line then the market is still in business and this might end up being just a consolidation area.  However, the VIX needs to start moving down away from its blue 15 EMA line asap because the longer it stays so close to it the longer the market is vulnerable to a line crossing triggered selloff.  

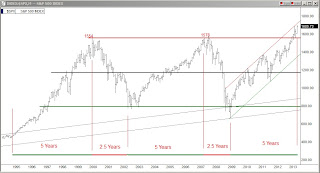
The second chart above is a 20 year chart of the S&P and the chart below it shows the breakdown in the bond market as the great bond bubble starts to deflate.

Trade well my friends

Alan

Tuesday, July 30, 2013

VIX At Threshold

Stock Market Technical Analysis Blog


click on image to enlarge


In the market today we had a brief warning from the VIX around midday as it crossed above the blue 15 EMA line.  This is of significance in that looking back at the history of the S&P and VIX we see that when the VIX gets above its blue line the stock market starts a selloff.  After the VIX has been above the line and crosses back down thru the line, the S&P starts climbing higher.  Today the S&P was getting close to the brink of a selloff as the VIX crossed above its blue line but in the last hour it has pulled back down below it.  Note that the S&P didn't get quite down to its blue line as would normally happen because the market is being propped up today relentlessly.  If the market had not been propped the S&P may have slipped thru its blue line just as the VIX was crossing above its line and caused a huge intraday selloff.  As we head to closing in a few minutes the alarm bells have quieted.  Nonetheless, the VIX is very close to causing a stock market selloff.  

If Bernanke says something positive tomorrow the blue line will probably push the VIX down causing a new move upward in the stock market.  However, if he says something the market doesn't like or not enough comments that are favorable to the market, the VIX may try to cross above its blue line again and if there are enough sellers at that moment it could cause the S&P to drop below its blue line and if it closes below it the market is in trouble.

This is a rather large pivot, could go either way.

Trade well my friends

Alan

Monday, July 15, 2013

How Extended Is The S&P?

Stock Market Technical Analysis Blog


Click on image to enlarge

Tonight I would like to take a look at a chart we last looked at about a year ago.  It is a weekly bars chart of the S&P with the 65 EMA line in blue.  Midterm overextension can be measured by how many points there are between the 65 EMA and current price.  Several overextended points have been plotted showing the numerical value of each.  The last overextension in mid May was extreme and a 5-week pullback followed.  Where the S&P closed tonight is just a few points from that same level but with the accelerating rise of the 65 EMA line the past few weeks the extension is about 20 points less.  Many traders are prepared to short the market tomorrow at the horizontal line across from the mid May peak thinking this might be a meaningful double top, others will be waiting to see if we can achieve the +212 over extension from the 65 EMA line instead.

The third argument is that neither is right and we will breach 1700 on the S&P.  This is also plausible especially if you take note that the May 24th bottom tick was a successful backtest of the upper line of the three and a half year channel (shown above) in addition to the backtest of the upper line of the 20 year channel that I focused on in Saturday's blog.  There is also disagreement as to whether we get just a small pullback or a multi-week pullback if we peak.  The channel lines are real but the move was forced with extreme manipulation.  

This is going to be interesting...

Trade well my friends

Alan

Saturday, July 13, 2013

Getting Past the Manipulation

Stock Market Technical Analysis Blog


click on image to enlarge


Over the past three weeks we have seen more market manipulation happening than in the past three years combined.  From the "spin the dial to a desired number" style opening of the evening S&P Futures, to the 4am SPY pumps on vapor thin volume, to the day after day after day of gap up openings in the market and refusing to let the market trade intraday, to the after the market was closed bombshell Bernanke dropped late Wednesday, we've seen it all.  Friends it is what it is, welcome to the new normal.   

To successfully play this market  we need to step back and look at the big picture and focus on where the manipulation is taking place which will also show us why.  
  • Chart 1:  In the 20 year monthly bars chart of the S&P 500, we have broken out of the 20 year channel.  We must forget that manipulation was used to break us out and instead focus on the price action itself.  
  • Chart 2:  A weekly bars chart of the S&P lets us zoom in and see where they stepped in with the massive intervention.  It was right as the price set down on top of the upper channel line allowing the intervention to push us up away from the upper trendline for a confirmed technical retest for the market to go higher without the channel constraints.  Looking at what was at stake at the moment that one weekly bar touched down on the line makes it easy to see why they have been doing what they have for the past three weeks.  
  • Chart 3:  A weekly bars chart of the VIX showing the 5 EMA in red and 75 EMA in blue, the EMA pair that WallStreet has been using for major scale ins and scale outs of the market for the past 15 years.  Looking closely at each time the red line reversed and was pushed down by the blue line, we had major multi month market rallies triggered.  Looking back to July 2011 we see that the last time the red could not be prevented from crossing above the blue which caused the huge plunge in the market as can be seen up in chart 2 at the first of July 2011.  Bernanke had to do something there and thus we got the v-shaped reversal that everyone hates.
  • Chart 4:  VIX weekly chart with red 5 and green 10 EMAs.  Everything above really explains what happened from three weeks ago up until the closing bell this past Tuesday.  Looking at this chart, at noon Tuesday the 5 was trying to start turning sideways on the green 10.  This absolutely could not be allowed to happen because a bounce there instead of a down cross could have easily turned the 5 back up enough to cross above the blue 75 line in chart 3 which would have triggered multiple 300-400 point down days in the Dow.  To prevent this from triggering something extremely bullish was needed by Wednesday morning and it did, Bernanke turned dovish in his tone and the entire risk on/ risk off balance was changed in a matter of minutes to the on side.
While technically the S&P bouncing up from the topside of its upper channel line is the biggest single technical event in the 20 year chart of the S&P, most traders loathe what has been happening and are still going to be biased to keep shorting which does nothing but provide fresh kindle for the following day's short squeeze.  If they can keep the shorts coming in and then squeezing the market higher with them, who knows how long this could keep going.  However, if the shorts get tired of getting burned and go to cash or to the longside then I will have a lot less confidence that this market can go much higher.  What I will be watching for is to see when the majority of the crowd have all switched to the bull side and if this happens it would be wise to keep your sell orders ready because it may not go much beyond that.

Trade well my friends


Alan

Wednesday, July 10, 2013

Bernanke Shows Up With Flowers Afterhours

Stock Market Technical Analysis Blog


Click on image to enlarge


After the nasty dip and rinse we had in the markets after Bernanke's speech a couple of weeks ago the stakes were high for his afterhours speech today especially after we learned from the Fed minutes of its last meeting, released this afternoon, that half of the governors wanted QE ended this year instead of ending in 2014 as Bernanke mentioned in his last speech which caused the hard market selloff two weeks ago.  Since his speech today was delivered after the market closed there was little movement in the market this afternoon outside of a little futures juicing at the key moments to get indexes a little  over their channel lines at the close which is not suprising.

In his speech this afternoon everything seemed a rehash until we got to the one line which was the equivalent of a bouquet of flowers, Bernanke said "I believe highly accommodative policy will be needed for the foreseeable future".  Upon saying this, the afterhours S&P futures rocketed 10 points higher and the SPY a full dollar higher.  

This was obviously to encourage investors to buy stocks instead of sell stocks.  Whether or not this afterhours spike will hold tomorrow is yet to be seen.  

Looking at the charts of the indexes to see where we are at (above) the two left side charts are 120 minute bar charts showing three months of trading in the Nasdaq & SPY where we see that today we bumped up against the upper channel line of both.   In the two right charts we see that the VIX and VXX (VIX Futures) are down to the lower line of their channels, the sell stocks area.  

Obviously, Bernanke's boys are trying to produce a market breakout that no one will believe and everyone will be chasing.  Is it possible?  We will have to see.  Normally, the VIX and VXX channels rule everything but if you look at how fast and furiously they drove the market back up after his last speech selloff you have to realize that Beranke was very unhappy with the selloff occurring and drove the market nearly all the way back up.  I would hesitate to call it a "rally" back up as there was virtually no trading movement intraday, they just simply gapped the market higher during the overnight futures again and again and again with nearly all of the daily candles on the trip back up being Dojis.  It's possible we may be about to witness the incredible power of Uncle Ben and the boys, we will see.

Trade well my friends

Alan