Stock Market Viewpoint

Stock Market Viewpoint
Reading the Tea Leaves...

Wednesday, November 13, 2013

Party on Garth!

Stock Market Technical Analysis Blog


click on images to enlarge


In the market today traders quickly shifted into a Wayne's World mentality and started buying with both hands and feet as we learned that Yellen's helicopter is not only likely to be bigger than Ben's but will have twin payload dropping trap doors.  Most notably the S&P / SPY broke out of its recent channel increasing the odds that we could have a parabolic bubble during Ben's remaining days.  


Taking a look at the charts above:
  1.  7-day intraday chart of SPY we see that it regained its steep channel from last week
  2. 120min bar chart of VIX showing red/blue down cross follow thru
  3. Day candles of SPY - a strong daily candle off the bollinger basis line, popular with newcomers to the market
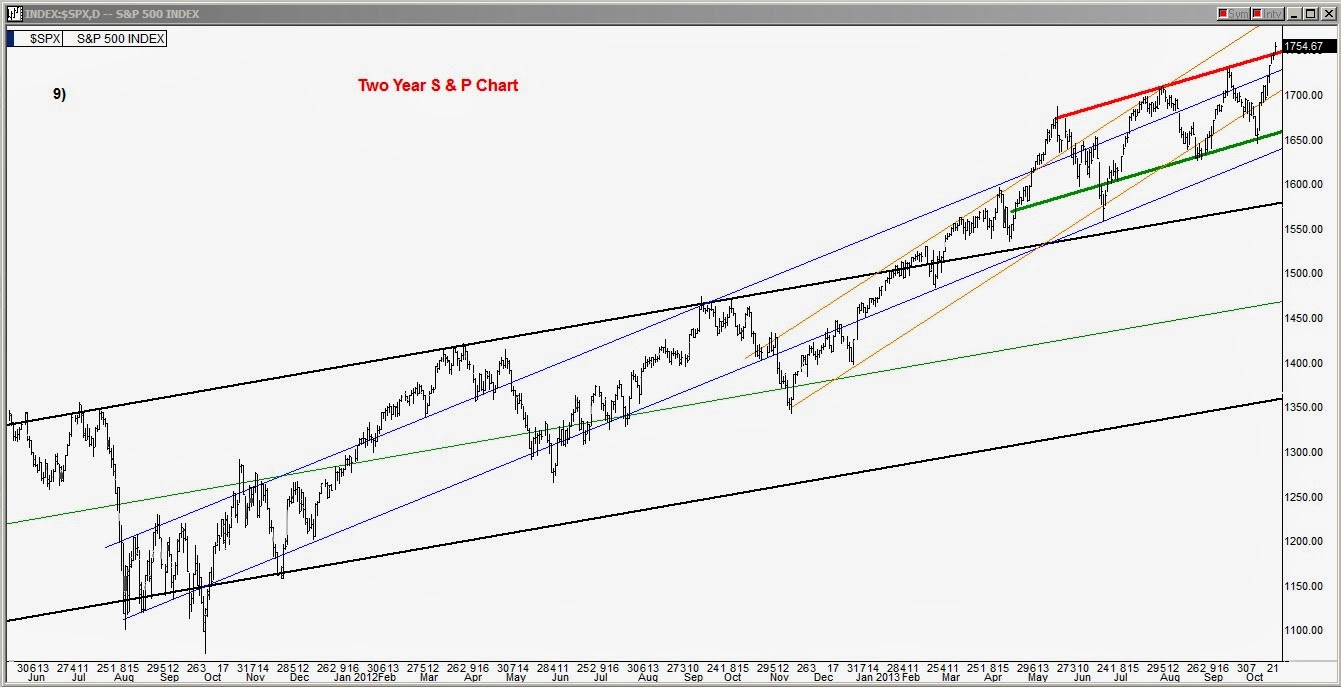
  4. Week candles of SPY shows us riding the upper rail
  5. SPY - going to pass on this orange/green lift as the market has been literally reeking of manipulation this past week
  6. VIX - continued slow EMA pushdown
  7. SPY - we are already establishing the first ramp up channel for a bubble
  8. VIX - approaching the danger of the 12.00 level but hey, who cares? looks like money will be falling from the sky for some time
  9. SPY -  pushing up from and rejecting the summer channel
  10. VIX - that silly VIX, who pays attention to that anyway nowadays?
  11. SPY - approaching its greatest overextension from its 100 EMA line ever
  12. SPY major EMA lift getting really long in the tooth now
  13. SPY bounced off the 15 EMA line today right on above upper float channel line in the newfound euphoria
  14. SPY ADX - if you have followed ADX on the SPY very long you just got to love that pattern lol
  15. SPY if you loved the ADX pattern, you will think what they are doing to the MACD reading right now is just peachy
  16. SPY do we really need all those big congestion SMAs anymore?
  17. SPY pusing higher off last resistance line
  18. SPY Fibonacci - good thing it didn't take long to post those Fibonacci lines
  19. SPY see you later blue channel?
  20. 25 year chart of S&P can't we find a steeper channel?
  21. 2-year chart of NASDAQ - could someone please erase those upper channel lines?  who needs them anyway
  22. 2-year chart of DOW playing by the rules but may not want to much longer
P.S.  Sorry for the cynical slant tonight, I really miss the old stock market where moves were real and manipulation was only occasional

Trade well my friends

Alan

Thursday, November 7, 2013

Sasquatch Roars Out of The Treeline

Stock Market Technical Analysis Blog


click on image to enlarge

In the market today Sasquatch, the monstrous short interest, who has been forced to cower in humiliation smelled the taper fears in the air and came charging out of the treeline with a pack of hungry bears right behind him.  His sudden appearance rattled a lot of investors and the selling mushroomed as the day went on.  We did have a noticeable divergence today however, as the VIX rose only modestly while the indexes heaved buckets which could trip up the bears if they get charging too fast.


Taking a look at the charts above:
  1.  7-day intraday chart of SPY we see that it is already down to the support of the lower line of the slowly descending channel it broke up out of
  2. 120min bar chart of VIX where we see a modest move stopping at the resistance of the red line
  3. Day candles of SPY - okay, that is one ugly bearish engulfing candle
  4. Week candles of SPY showing primarily today's drop
  5. SPY - orange and greens lines should come to a juncture tomorrow
  6. VIX - orange and greens lines should also come to a juncture tomorrow
  7. SPY - did slip below the upper channel line finally
  8. VIX - bears need to be cautious here, not much of a VIX move for such a huge selloff and the VIX is well within its orange channel containment
  9. SPY -  shows bigger picture view of SPY dropping below upper channel line
  10. VIX - shows the fat fingered double bottom the bears would like to get some mileage out of
  11. SPY - the spitwad finally starts coming loose from the ceiling
  12. SPY major EMA lift getting a little long in the tooth
  13. SPY lost both the lower float turnover channel line and the 15 EMA line in one day
  14. SPY ADX - plus, minus line are closing in on each other quickly
  15. SPY slips below its 5th Gann ray sector,  MACD downcrosses to the delight of the bears
  16. SPY still a little above the congestion of the traditional large SMAs
  17. SPY shows a support line not far below if we do go lower tomorrow
  18. SPY Fibonacci - new Fibonacci rack in place, we're halfway down to the first refreshment stand, the 38% retracement with huge red volume today
  19. SPY 2-year chart shows it did fall back down into its two year blue line secondary channel
  20. 25 year chart of S&P
  21. 2-year chart of NASDAQ - a very important chart to examine as the Nasdaq has been climbing from its lower channel line to its upper for an entire year and is now stalling at the upper line.  Well known that it has been the leader for the bullish sentiment.  Today's big loss on the Nasdaq could easily be a game changer as far as broad senitment goes.
  22. 2-year chart of DOW showing it is at its upper line of its horizontal blue channel, not much damage here today

Trade well my friends

Alan

Monday, November 4, 2013

Bubble Anyone?


Stock Market Technical Analysis Blog


Click on image to enlarge


In the market today we had a modest up day which in itself is nothing special  until you consider the fact that SPY bounced up from the top side of its upper channel line on Friday.  Repeating my closing comments of my 10/24 blog where I mentioned that we could easily enter uncharted territory here and see all rules and logic thrown out the window.  Friday's bounce from the topside of the channel raised eyebrows and has certainly increased that chance of something crazy starting here and we have seen conversation across the grapevine that Ben may actually be considering a hyperbolic bubble as his last hurrah before he exits.  

It has become pretty obvious that the Fed will not be able to turn off the QE steroids without causing substantial damage to the market possibly in the 15% range.  The argument that he may be about to fiercely bubble the market up that 15% from here then pull the QE plug which will then likely drop the market 15% but in reality it would just take us down back to where we are at now. Problem solved, no biggie right?  

It sounds crazy but with the incredible manipulation going on the past few weeks it looks like Ben is up to something.  If you really think about it this might be the only way he can get himself out of the corner he has painted himself into.  Disregarding the fact that stock market bubbles have a history of not ending very well, it's quite possible that may be what's coming or at least Ben may be trying to figure out if he could succeed in such a venture.  

Taking a look at the charts above:
  1.  7-day intraday chart of SPY showing its climb back up toward the Prop-toberfest tractor program's high
  2. 120min bar chart of VIX showing we how missed a bullet over the past few days as the red line crossed down through the blue line instead of bouncing up from it. This was possible because the red line of the VIX was coming down at a fairly steep angle due to the tractor program running on the SPY for so long.
  3. Day candles of SPY showing a hammer
  4. Week candles of SPY showing a hanging man early in the candle after closing as a shooting star last week
  5. SPY bouncing with a little too much air between the lines 
  6. VIX in an EMA pushdown situation now
  7. SPY - a close up view of Friday's eyebrow raising bounce up from the top side of the upper channel line
  8. VIX now descending
  9. SPY -  a bigger view of Friday's top side line bounce in the SPY
  10. VIX taking aim for its lower channel line again
  11. SPY still ridiculously overextended from its 100 day EMA
  12. SPY major EMA lift getting a little long in the tooth
  13. SPY now has the upper float turnover channel line at the tractor program high with its turn up not even close to the 15 EMA line
  14. SPY ADX - plus, minus line divergence can be interpreted as sellers backing off but buyers still hesitant to come in 
  15. SPY shows it bounced back up into its 5th Gann ray sector Friday, with MACD re-opening
  16. SPY is still well out of the congestion of the traditional large SMAs
  17. SPY passed back above the previous week's spike
  18. SPY Fibonacci - will take a couple days before I post another Fibonacci set.  Noteworthy is the fact that the SPYs volume should have been up in the 175 million range if today's move was genuine buying and not manipulation. It instead came in at an anemic 80 million
  19. SPY 2-year chart shows it bouncing up from the top side of the two year blue line secondary channel
  20. 25 year chart of S&P
  21. 2-year chart of NASDAQ - a very important chart to examine as the Nasdaq has been climbing from its lower channel line to its upper for an entire year and is now stalling at the upper line.  Well known that it has been the leader for the bullish sentiment
  22. 2-year chart of DOW showing it is at its upper line of its horizontal blue channel


Trade well my friends

Alan

Wednesday, October 30, 2013

Prop-toberfest Winding Down

Stock Market Technical Analysis Blog


Click on images to enlarge


In the market today we saw the end of the powerful 5-day tractor program that Ben had clamped down on the market, forcing it to trade in a narrow tube slightly upward as seen in chart 1 above. It served him well by getting the market as high as possible even though we were at the upper channel line a week ago to put some cushion below the current level in case the market reacted severely to his change in rhetoric to a less dovish stance which is in a way a bit of relief as it appears now that at least there really was a purpose for the 5-day tractor program and not the beginning of a dangerous bubble (at least let's hope not).

Taking a look at the charts above:
  1.  7-day intraday chart of SPY showing 5-day tractor program that was turned off at the open today
  2. 120min bar chart of VIX showing two very large EMAs that are notorious for triggering major selloffs when the red EMA crosses above the blue EMA or bounces up from the blue EMA.  We closed with the two merging at a point
  3. Day candles of SPY showing today's selloff
  4. Week candles of SPY showing a topping shooting star as of this evening
  5. SPY managed to close right at its orange EMA 
  6. VIX shows big jump at the open today
  7. SPY not down to its upper channel line yet
  8. VIX trying to break out of its orange sideways channel
  9. SPY dropped considerably today
  10. VIX re-energized after consolidating at lower channel line
  11. SPY still ridiculously overextended from its 100 day EMA
  12. SPY momentum fading as major lift appears to be done
  13. SPY selloff agrees with upper float turnover line and shows it is still away from the 15 EMA line
  14. SPY ADX - shows the expansion between the positive and negative line is now contracting 
  15. SPY shows it is still well up in its 5th Gann ray sector and the MACD below it is starting to show some fast line closure
  16. SPY is still well out of the congestion of the traditional large SMAs
  17. SPY closed right at the line over from last week's spike
  18. SPY Fibonacci - will take a couple days of selling before I post another Fibonacci set from the top down.  Also, note the huge red spike in volume today after volume had declined steeply for three weeks 
  19. SPY 2-year chart shows it is still above the steeper two year blue line secondary channel
  20. 25 year chart of S&P
  21. 2-year chart of NASDAQ - a very important chart to examine tonight as the Nasdaq has been climbing from its lower channel line to its upper for an entire year and is now stalling at the upper line.  Well known that it has been the leader for the bullish sentiment
  22. 2-year chart of DOW showing it is at its upper line of its horizontal blue channel

For the next couple days Chart 2 above will likely be Ben's greatest concern if the red line starts lifting above the blue line because then real trouble starts for the market as can easily be seen with its previous line junctures.

Trade well my friends

Alan

Thursday, October 24, 2013

Bears Sniffing the Air, Looking A Little Confused

Stock Market Technical Analysis Blog


click on image to enlarge


In the market today we had a slightly up day as the sideways propping continued that I mentioned I was expecting this week in Monday's blog.  It's been a bit more than propping though as they clamped down a tractor program on the market yesterday that has kept the S&P in a very narrow almost straw-like tube for two days, effectively locking down the market right where it's at.

While we are still lower than we were on Tuesday, more than a few eyebrows were raised this afternoon as the VIX started drifting downward with the SPY still right at the upper channel line after dropping below it yesterday.  What Ben & Co have planned for their parting hurrah is anyone's guess, however, since the initial drop at the first of the week we are in a slight uptrend these last two days.  The bears are no doubt watching this closely somewhat confused as the VIX should be climbing higher as the market goes sideways, the common prelude to an upcoming decline to the lower channel line on the S&P.

Taking a look at the charts:
  • Chart 1:  Daily candles - another slightly bullish hammer today but with no multiday decline in front of it, it is obviously manipulation
  • Chart 2:  Weekly candles - yesterday's shooting star formation is starting to have the body fill in today as it approaches the possibility of becoming a neutral candle by tomorrow night
  • Chart 3:  yesterday's orange line support was what gave the market some modest upward movement today
  • Chart 4:  yesterday the VIX had freshly crossed above its orange EMA line looking to climb higher but today we see that it dropped back below it, an afternoon victory for the bulls
  • Chart 5:  60 min bar chart of the SPY - while we haven't regained the blue ascension channel we are back up and slightly above the upper red channel line
  • Chart 6:  60 min bar chart of the VIX - the 3 day uptrend was breached as the VIX slipped below its 3 day orange channel
  • Chart 7:  shows the SPY has moved back up today to exactly its upper channel line
  • Chart 8:  shows the VIX starting to decline today
  • Chart 9:  shows the SPY is extended away from its 100 day EMA line, about as far as it ever gets away from it and also shows the still steadily decreasing volume 
  • Chart 10:  the major lift EMAs have done their job once again
  • Chart 11:  the SPY is positioned well above the congestion of the large traditional SMAs
  • Chart 12:  shows how yesterday's low got support from the line coming across at the Bernanke no taper speech pop
  • Chart 13:  we are far from having a major Fibonacci line come into play
  • Chart 14:  the two year chart of the S&P showing how it has bubbled out of its primary black line channel
  • Chart 15:  the 25 year chart of the S&P showing we still have another 2-4 months in the current 5 year supercycle
Looking forward we could easily enter uncharted territory here and see all rules and logic being thrown out the window.  Maybe not but it's something to keep in mind.

Trade well my friends

Alan

Wednesday, October 23, 2013

Sasquatch Strikes Back

Stock Market Technical Analysis Blog


click on image to enlarge

Sasquatch, the monstrous short interest, was out feeding early this morning and took a healthy bite out of the bulls.  Not a major wound yet as the bulls are still standing.  Considering the fact that Ben & Co are within 90 days of flying the coop and they will likely have to walk off with the QE waterhose laying on the ground running full force, I am expecting lots of market propping every chance they get.  Ben will likely want the market to be at an all time high as he exits but between now and then it could be choppy and all over the place.

Taking a look at the charts:
  • Chart 1:  No clear short term direction yet but today's low did find at least temporary support at the orange EMA line
  • Chart 2:  60 min bar chart of the SPY showing the short term ascension channel that we fell out of today but not that far as there was plenty of propping in the afternoon
  • Chart 3:  Weekly candles - is showing a topping shooting star at midweek but we have to see how it closes Friday night
  • Chart 4:  Daily candles - we have a hammer reversal candle today - caution - no guarantees as there is contradition between the weekly and daily candle and there hasn't been enough down trading days in front of today's hammer to give it much strength for reversal
  • Chart 5:  60 min bar chart of the VIX showing its short term descending channel, note it continued its uptrend for the third day
  • Chart 6:  shows the SPY dropped back down below its upper channel line
  • Chart 7:  shows the VIX is building a base at its lower channel line
  • Chart 8:  shows the SPY is extended away from its 100 day EMA line, about as far as it ever gets away from it and also shows the steadily decreasing volume as the rally went higher
  • Chart 9:  the two year chart of the S&P showing how it has bubbled out of its primary black line channel
  • Chart 10:  the 25 year chart of the S&P showing we still have another 2-4 months in the current 5 year supercycle

Trade well my friends

Alan

Tuesday, October 22, 2013

Messing With Sasquatch

Stock Market Technical Analysis Blog


click on image to enlarge

In the market today, Wall Street decided there was no need to pull the plug on the party just yet as they undertook a champagne celebration short squeeze based upon the fresh evidence of a worsening job market and QE possibly indefinitely.

Early on they decided it would be fun to mess with sasquatch, the monstrous short interest that shows up at the perfectly defined upper channel line.  Squeezing out of the channel in itself is fine as long as you remember that sasquatch can be really sneaky and likes to feed in the early morning hours (premarket session) when most people can't exit their positions.

Taking a look at the charts:
  • Chart 1:  I'm not chasing a short squeeze above an upper channel line
  • Chart 2:  60 min bar chart of the SPY showing the short term ascension channel
  • Chart 3:  Weekly candles - has an indecision candle
  • Chart 4:  Daily candles - also has an indecision candle again today
  • Chart 5:  60 min bar chart of the VIX showing its short term descending channel, note it continued its uptrend today despite the bad jobs report celebration in the market
  • Chart 6:  shows the SPY reached its upper channel line last Friday
  • Chart 7:  shows the VIX dropped to its lower channel line last Friday
  • Chart 8:  shows the SPY is extended away from its 100 day EMA line, about as far as it ever gets away from it and also shows the steadily decreasing volume as the rally went higher
  • Chart 9:  the two year chart of the S&P showing how it has bubbled out of its primary black line channel
  • Chart 10:  the 25 year chart of the S&P showing we still have another 2-4 months in the current 5 year supercycle

Trade well my friends

Alan

Monday, October 21, 2013

S&P Stalls At Upper Channel Line

Stock Market Technical Analysis Blog


click on image to enlarge


In the market today we had a flat closing as the S&P turns sideways at its upper channel line.  
  • Chart 1:  I closed the SMV model portfolio trade today for a 4 percent gain from the line cross entry.
  • Chart 2:  60 min bar chart of the SPY showing the short term ascension channel
  • Chart 3:  Weekly candles - has an indecision candle
  • Chart 4:  Daily candles - also has an indecision candle
  • Chart 5:  60 min bar chart of the VIX showing its short term descending channel
  • Chart 6:  shows the SPY reached its upper channel line last Friday
  • Chart 7:  shows the VIX dropped to its lower channel line last Friday
  • Chart 8:  shows the SPY is extended away from its 100 day EMA line, about as far as it ever gets away from it and also shows the steadily decreasing volume as the rally went higher
  • Chart 9:  the two year chart of the S&P showing how it has bubbled out of its primary black line channel
  • Chart 10:  the 25 year chart of the S&P showing we still have another 2-4 months in the current 5 year supercycle
With the S&P now at the upper channel line, I feel there is a pretty good chance they will keep it sideways and choppy at that line for a few days to put a little more lipstick on the debt extension.


Trade well  my friends

Alan

Friday, October 18, 2013

Partying Like It's 1999

Stock Market Technical Analysis Blog


click on image to enlarge


We've had an amazing week of stocks just running and running, you could pretty much say we have been partying like it's 1999.  However, taking a look at where the SPY is at in its channel (chart 1) and where the VIX is at in its channel (chart 2) and how far we are extended from the 100 day EMA line (chart 3) it might not be a bad idea to start thinking about calling for a taxi ride home soon.  

Trade well my friends

Alan