Stock Market Viewpoint

Stock Market Viewpoint
Reading the Tea Leaves...

Wednesday, August 31, 2011

Big Decision Point Arrives 8/31/11

Stock Market Technical Analysis


Click on above images to enlarge

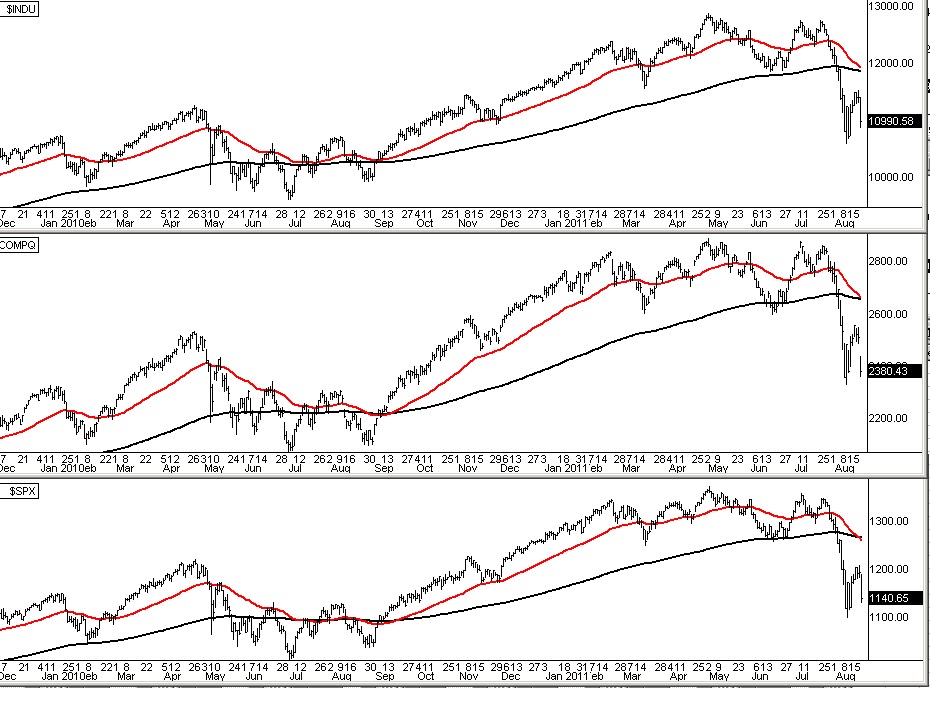
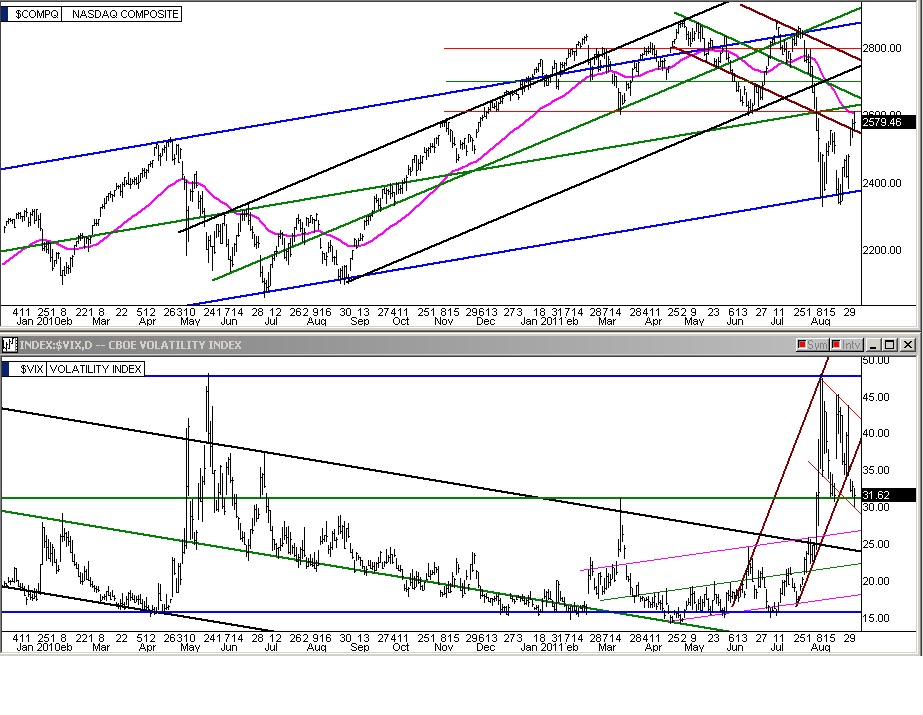
The market wringed out another small gain today as the VIX did indeed slip down through the center line of its four year horizontal blue channel that I mentioned it would have to do last night (shown in chart 2 above).   As the markets reached the high of the day, the VIX bounced up from the lower line of its four week downhill red line channel (also in chart 2 above).  Right as the VIX bounced from there, the NASDAQ bumped its head up against the 50 EMA line shown in pink in the top chart and also the underside of ten month wide horizontal red line channel in that same chart.  In addition to that, the SPY (S&P Trading ETF) bumped up against its pink 50 EMA line and also the underside of its three year blue line mother channel.  This is really serious that the SPY and the NASDAQ hit double major resistance at the same time and also right as the VIX finds support and reverses at two support lines. 

To make things worse, today's candle on all three above charts is a Doji reversal candle.  The market absolutely cannot stall out here or the bears will pour in with a vengeance.  The situation on the SPY & NASDAQ charts above is going to give the bulls pause as they decide if they think they can push the market up through double resistance on the two key charts. 

If the VIX stays above the green center line of its four year horizontal channel, the markets will once again become vulnerable to any bad economic news.  The bulls really want the VIX to break down through the long term green center line and out of that descending channel.  Although the thin red channel on the VIX is descending which is bullish, staying in that channel could have the VIX making a run back up to the about the 40 point level.  If that begins tomorrow, the SPY will be in double trouble as it would only get deflected down by its 50 EMA and it will also have executed a channel recovery attempt failure unable to get back into its three year uphill blue channel.  Also if the VIX reverses here, the NASDAQ's 50 MA could swat it back down out of its four month downhill brown channel for a channel recovery attempt failure on that index.

The bulls must put their money where their mouth is tomorrow as the bears are sitting, watching, and ready to maul this low volume rally.

Alan

Tuesday, August 30, 2011

NASDAQ and VIX 8/30/11

Stock Market Technical Analysis
Click on above image to enlarge

The above images are 1 1/2 year charts of the NASDAQ in the upper chart and VIX (Volatility Index) lower chart.  The NASDAQ had a small gain today but it was enough to get it back up into its 4 month downhill brown line channel.  The problem though is that when the VIX touched the center line of its 4 year wide horizontal blue line channel today, it turned back up as it did a couple of weeks ago.  The VIX absolutely must drop through that center line of this long term channel if this market is to keep  climbing.

Alan

Monday, August 29, 2011

Plan B: Gap & Squeeze 8/29/11

Stock Market Technical Analysis
Click on above image to enlarge

After three days of the market attempting to break out but getting stopped when the VIX hits its lower channel line and its 20 EMA (exponential moving average), they finally said enough with trying to trade the market up and instead went with  Plan B the market gap and squeeze as I mentioned they might on Friday.  This took the VIX well out of its uphill channel and brought some money back into the market today. 

While the NASDAQ is already attempting to break out of its 3 week channel (thin pink line) all eyes will be on the DOW and S&P when they hit their upper pink line channel shown on the death cross charts on the right sides.  One might get the feeling that Bernanke might be trying to sell us on the idea that the DOW just barely did a death cross so let's pretend it didn't.  Either way, the shorts are getting squeezed hard and as long as the market doesn't have a meaningful pullback more and more shorts will buy in to cover, throwing more kindling on a short squeeze fire. 

Also, the VIX has to deal with the 29.80 level as shown by the lower line of its declining red channel.  If it breaks down through that red channel then the shorts will know the cat is out for sure and this market could have a sustained run. 

Alan

Friday, August 26, 2011

He speaks softly but carries a big stick 8/26/11

Stock Market Technical Analysis
Click on above image to enlarge

At the open today, the market started selling off from the VIX bouncing up from its 20 EMA and lower brown channel line.  As 9 am approached, the Bernanke speech text was pre-released and immediately it was revealed that he has no new plan to boost the economy and the DOW dropped 100 points in 2 minutes sending the VIX up to the 42 level where it reached the downhill channel shown with the thin red lines.  The very moment the VIX hit that line, and I mean the second it hit it, a neck snapping buy program was unleashed by Bernanke, Geithner, & team.  The market exploded one minute after it was in freefall.  The DOW ran 350 points to the high an hour and a half later.  I marked with a green dot the VIX high point where the program kicked in. 

The VIX fell quickly as the market jam was taking place but when the VIX got down to the brown channel line and the blue 20 EMA line, the markets stopped cold and couldn't get above that level the rest of the day.  This takes us right back to a replay of the big pivot point we had the night before last where once again if the VIX falls out of the brown channel and through the blue 20 EMA line the rally is on but if it bounces up from there the rally is off again. 

Such a buy program has happened many times this year but up until now everytime they have sent through anywhere from one to three 1m share block buys of the SPY (S&P 500 ETF) at a full $1 premium above the current trading price to mark the level the market would be jammed to.  In the first half of the summer, these marker trades the Fed would send out to signal how far they were going to jam the market up became larger, often 1m share blocks at $1.50 to $2 above the current trading price.  This was an amazing way the Fed communicated how much they were going to take the market higher.  Unfortunately, in late July the Fed still sent out premium market trades but all of a sudden the market jam did not follow and that started to create panic amongst professional traders and the market sold throughout the first week of August.  The general concensus has been that because of the budget battle the Fed was not free to spend the funds needed and was hoping that just the threat of jamming the market higher might get the shorts to cover and take the market up for them.  However, the shorts quickly realized the Fed had run out of funds to jam the market at pivot points and the bloodbath of August took place. 

This morning's market jam was a different tool that the Fed hasn't done since last summer - a synchronized to the second rocket launch rally of every stock (all pivot point market jams this year were presignaled by the premium SPY blocks sent through ahead of the SPY being jammed higher and then all other stocks followed gradually).  If this is going to be the Fed's new way of making the pivots go the upward direction, this could be a very powerful tool as now the shorters in the market (after getting scalded this morning) realized they've got to be careful because the Fed obviously has the ability to spend the funds again to make it happen.  This could be a game-changer for a heavy market if the funds are there to do it often enough.  That variable is yet to be seen. 

Looking at the chart we see that once again we are right back down to the lower channel line of the VIX and blue 20 EMA line, leaving us back in a volatile situation for the open on Monday.  It could go either way, super fast.  If the Fed could do a monster gap open which has been an occasional tool of theirs, then they could cause the shorts to really panic and the VIX could be driven down to the thirty level and possibly breakdown through the lower thin red declining channel line which could form an amazing multiday rally.  However, if the market opens even slightly down on Monday then once again the VIX will be bouncing up from the brown channel line and blue EMA and pointing the market in a downward direction instead. 
Alan

Thursday, August 25, 2011

Not Good 8/25/11

Stock Market Technical Analysis


Click on above image to enlarge

The background image above shows that after today's selloff, the DOWs 50 dropped through its 200 confirming a triple death cross on all three indexes.

The market did indeed sell off today.  All the talking heads in the financial media were out touting that Steve Jobs resignation would have no effect on AAPL, and in the Level II window you could easily see that all of its market makers were aggressively defending the stock.  Nonetheless, today's sell off probably would not have happened if the market had not been left vulnerable because of shocked tech stock fans this morning.

Jobs resignation announcement could have waited a day.  One day later and today might have had a different outcome.  In the past, positive announcements from Apple have been timed to help both AAPL and the broad market, and negative announcents were never released at big pivot points.  At yesterday's close we reached a big pivot point. The VIX (fear index) had just got down to its 20 EMA line and the lower line of its big uphill channel. ( This morning's market push - Warren Buffet's BofA buy in announcement -was timed to break us down thru the 20 EMA line and lower channel line of the VIX and confirm a new leg up.   Instead the tech stock sentiment was so sour this morning the market was quite vulnerable.  The very minute the VIX began to bounce up from, instead of dropping down thru that lower channel line a massive computer sell program kicked off in Germany and took the DAX down sharply spooking the market lower.  If  the AAPL announcement had come after the bell today instead of last night then the VIX would likely have broken down this morning when they wheeled out Warren Buffet and a sustainable rally would have been confirmed, which wasn't the case and before we had a chance to drop out of the VIX channel the VIX reversed and turned up at the 20 EMA and its lower channel line also, setting up the market to begin another leg downward if we don't get some sort of really major announcement from Bernanke on Friday that investors feel will actually help the economy.  Timing is everything and it appears that AAPL missed it by a day this time and indirectly caused a market downturn reversal at a volatile and sensitive pivot point - the VIX right at its 20 EMA line and its lower channel line.
 
I overlayed two VIX charts on top of the triple index chart.  The upper VIX chart shows it bouncing from its lower channel and the lower shows it bouncing from blue 20 EMA .  There is little doubt the VIX would have dropped out of this channel and down through the 20 line at today's open if the market had not been vulnerable from the loss of the innovative genius of Steve Jobs.

Alan

Wednesday, August 24, 2011

Steve Jobs Resigns 8/24/11

Stock Market Technical Analysis

Click on above image to enlarge

Apple is the largest component of the NASDAQ and S&P 500 indexes.  The S&P Futures dropped .5% afterhours on the news.  Buckle up for tomorrow...

Alan

Tuesday, August 23, 2011

A Good Start 8/23

Stock Market Technical Analysis


Click on above image to enlarge

Sure enough the rabbit was pulled out of the hat today thanks to Bernanke, Geithner, and our good friends at Goldman Sachs (lol).  They jammed the DOW hard just as the 50 was starting to slip through the 200 this morning and away the market went.  While this is a good start to a potential new leg up in the market, it absolutely must have consistent follow thru on good volume in order to force the shorts to cover and get a short squeeze going.  If we instead have a big "give it all back day" on stronger volume than the up day before it, or volume starts a slow decline as prices climb then we will be in trouble again quickly. 

The VIX (Volatility Index) did confirm that it is in a downtrending channel today but it has so many short term uphill channels passing through in this area that it will reverse and start climbing again if we have any  bad economic news in the next few days.  The time and sales log showed there were numerous institutional buys and hedgefund activity which is a good sign.  There are other moving average retests happening right now that are also quite positive, the DOW is working a 5/200 on the weekly chart and also its monthly price bar caught support at the 100 month EMA. 

The SPY ETF caught support at its 150 month EMA and the SPY is also working a 5/200 weekly and 5/260 weekly bounce.  Gold dropped out of its 2 1/2 week up channel today.  The QQQ (NASDAQ 100 ETF) caught support at its quarterly 200 EMA and is laying up nicely for its 5/200 bounce on the day. 

Overall, you could say they stepped in when they absolutely had to and not a minute before but at least they did come in with enough push to stop the death cross on the DOW.  With a few days follow thru, we could see the NASDAQ 50 emerge back topside of its 200 just as it did the first week of September 2010.  The early bird buyers definitely went in today but many investors will want to see a few good days back to back for a change before everyone goes back in.

Alan

Monday, August 22, 2011

Tuesday is last chance for the bulls 8/22/11

Stock Market Technical Analysis


Click on image to enlarge

Today's market action needed to be a lot better than it was.  If Wall Street is going to save the DOW from the death cross, tomorrow is it.  The NASDAQ is already showing its 50 under the 200.  They are going to have to pull a rabbit out of the hat and it better be a big rabbit.  We will just have to see.

Alan

Friday, August 19, 2011

Big Pivot Monday - Tuesday 8/19/11

Stock Market Technical Analysis
Click on above image to enlarge

On Monday's open everyone will be watching the DOW to see if its 50/200 lines start a bounce or begin the downward death cross.  If the DOW  steps up to the task it will save the NASDAQ from losing its neutral position and start to reverse the S&P death cross.  If the DOW doesn't bounce Monday, the bulls will have to pull back to their last line of defense,  the lows of last week which are marked with a thin red line on all three index charts.  The afternoon sell down dramatically increases the pressure on the bulls to make it happen Mon/Tue.  Buckle up as their could be huge volatility swinging the market in either direction and possibly back and forth until the 50/200s are resolved.

Alan

Intraday Update 8/19/11

Stock Market Technical Analysis
Click on above image to enlarge

Deja Vu day one beginning?  A quick follow up from last night, right as the bottom chart S&P succumbed to the death cross and just as the NASDAQ is threatening to, the DOW's red 50 line is poised to start turning sideways and attempt a  50/200 line bounce.  If they can push the market higher into the bell today and then jam the market higher fiercely come Monday, it will reproduce the scenario from Friday 8/31/10 (marked with a green line).  Today's close and Monday's open is critical, this will be a close one as it could easily go either way.

Alan

Thursday, August 18, 2011

Death Cross Situation 8/18/11

Stock Market Technical Analysis

                                                  click on above image to enlarge
A little bit tonight about the potential death cross situation across the three big indexes.  The red line is the 50 EMA and the black line is the 200 EMA.  A death cross is when the 50 line crosses down through the 200 line.  The top chart is the DOW, center NASDAQ, bottom S&P 500.  Before I discuss what is happening now is worth taking a look at what happened in late August last summer.  Last August, the S&P executed a death cross convincingly in the latter half of August shown by the red line going underneath the black for several days.  At that same time, the NASDAQ just barely had its 50 slip below its 200 for a miniscule death cross while at the same time, the DOW executed a 50/200 line bounce in the last half of August.  The market unfolded with the S&P going down first and quickly but just when the NASDAQ was starting a death cross,  the DOW suddenly had a 50/200 line bounce instead of a down  cross which kept the NASDAQ from being a convincing death cross and actually was twisted back up to appear to be a bounce instead which caused enough short squeezing to totally reverse the completed death cross on the S&P within a matter of days.

The same exact scenario could be unfolding here this week.  The S&P has already suffered the death cross over the past two trading days but right now the NASDAQ is at the point where it could begin the death cross over the next couple of days.  If the DOW is supported over the next few days, it will allow it to do a 50/200 bounce instead of a death cross which if timed correctly will stop the NASDAQ death cross as it is beginning and reverse the death cross the S&P has already suffered.  This could be an exact repeat of last year.

The key is the DOW, it has to trade sideways over the next several days.  If it does history could easily repeat itself here.  The key points to watch are last week's lows on all three indexes.  If any of the three break through last week's  low the market sentiment could sour enough to bring in sellers on the DOW also and if it lasted for a couple of days a totally opposite scenario could happen in that we could have a triple death cross which last happened on January 18 2008 which made for a poor first half of the year leading up to the credit default swap fiasco coming into light in the summer. 

All of Wall Street's super computers will be closely tuned to this situation.  Maybe a few of the DOW stocks will get upgraded during the next couple of days to draw in tier two institutional fund buying along with a void of bad news out of Europe, the bulls might have something to hang their hat on.  This is a serious situation because the economic news was very dissappointing this morning with a really bad drop down in the Philly Fed Number.  The bad economic backdrop seems to put the odds in favor of a failure on the DOW death cross but if Wall Street decides to jam the market at just the right point during the next couple of days it could trigger a wicked short squeeze which is exactly what happened last summer on 9/1/10 where the short covering lasted for weeks and the market traded upwards even though the S&P had a confirmed death cross.  We will see, it will be a very interesting week...

Alan