Stock Market Viewpoint

Stock Market Viewpoint
Reading the Tea Leaves...

Wednesday, October 31, 2012

Weekly Charts Updated

Stock Market Technical Analysis Blog

Click on image to enlarge

(Triple Index Interpretation Guide located in October 30th Blog)


I am reposting the three key weekly bars charts from last night's blog because this week's weekly bar just opened this morning from the weather shutdown.  We can see how adding this week's new bar took the VIX (Volatility Index) in the top chart to a pinpoint merge.  The new bar tightened the two EMAs on the stocks chart in the middle as the bonds continued their sideways pancake merge with the new bar.  Obviously, a new direction being determined by an up cross or down cross in each of the three can't really happen until the end of next week's weekly bar.

What a coincidence, isn't there an important event next week?

Alan

Tuesday, October 30, 2012

VIX Nasdaq & Bonds

Stock Market Technical Analysis Blog

Click on image to enlarge


In this evening's blog I would like to add a third component to Sunday night's blog, that being the bonds chart.  In the cluster above I have the VIX (Volatility Index) at the top, Nasdaq ($COMPQ) in the middle, and TLT (bonds ETF) at bottom.

It is just this simple: when the VIX goes up, the Nasdaq goes down, and bonds go up.  In all three of the weekly bars charts above I have applied the SMV®  Sentiment EMAs.  


Every financial adviser you speak with will tell you it is impossible to time the market and you will hear the same spiel from the financial media but it is just simply not true.  Looking at all three 6-year charts above I have drawn vertical lines at each of the fifteen times the Sentiment EMAs have intersected.  After each intersection or merge happens, if the red EMA rises above the green, the direction in that symbol is to the upside.  If the red goes below the green, the direction is to the downside for that symbol.  

The system is to buy or sell the particular symbol based upon the direction the red starts after the merge of the two begins to separate and then exit the trade when either it has become overly extended in the direction it is  going and/or it reaches the major channel line in the direction.  Notice that each time there was a green buy signal on the Nasdaq there was a sell signal on the bonds and the VIX also went down.    Each time there was a buy signal in the bonds, the Nasdaq went down and the VIX went up.  These three work in synchronization nearly 100% of the time.  In times of erratic market behavior or heavy market manipulation you can still correctly evaluate the market direction by taking into context the position of the two ema lines in all three symbols together.


For the past six years, the SMV® Sentiment EMAs have been 15 out of 15 for showing when to go into stocks and when to go into bonds.  

Alan

Sunday, October 28, 2012

Nasdaq vs VIX

Stock Market Technical Analysis Blog

Click on image to enlarge


I posted in the charts above, seven-year weekly bars charts of the Nasdaq & VIX (Volatility Index).  In next week's bar or the following week's bar of the VIX we will see the red EMA come into contact with the green EMA after six months apart.  Also, within the next two weekly bars we will have the red / green contact once again in the Nasdaq.

In the Nasdaq the bulls want the red to bounce back up from the green and the bears want it to pierce down through.  In the VIX the bulls want the red line to meet resistance at the green and turn back down and the bears want it to cross up through to the topside of the green.  Considering these are decent sized moving averages on weekly bars it is possible to take three to four weeks to get their line interactions resolved in one direction or the other.  By studying each line interaction on the Nasdaq chart at the top then looking directly below at the VIX chart you can easily see how they trade inversely virtually all the time.

New one to three month trends are usually established after the two lines have stayed together for a couple of weekly bars and start to separate again.  We will need to watch these charts over the next few weeks to see if an Xmas rally is in the cards.  


Alan

Thursday, October 25, 2012

We're At The Edge

Stock Market Technical Analysis Blog


Click on images to enlarge


I posted two and a half year trendline charts above of the seven most important symbols.  In each one we have arrived at a make or break pivot which could easily have multi-month consequences in either direction.  

You can argue that with everything right at the edge and AAPL missing on its earnings after hours we are about to fall over the edge.  The other side of the argument is that they absolutely have to step in and rescue the market now or they will wish they would have.  We will see...


Alan

Wednesday, October 24, 2012

AAPL

Stock Market Technical Analysis Blog

click on image to enlarge


Short on time so I have just a quick chart of AAPL tonight.  It's easy to see why they are so determined to defend the 615 level on AAPL.

Alan


Tuesday, October 23, 2012

They Tried and Tried and Tried

Stock Market Technical Analysis Blog


Click on images to enlarge


Following up from last night's blog where we were looking for AAPL to break out of its five week down channel today off a continued push from yesterday and the iPad mini release today.   Unfortunately, in the early premarket session around 4am, AAPL and  SPY both started selling down, which continued into a serious sell off when the regular session started.  The problem in the premarket was that AAPL tried twice to break out of that channel (shown in middle cluster, top right chart) and failed both times causing it to sell down in to the open and then right after the open it slipped back down through the red 108 EMA line shown in the upper cluster, lower row, center chart.  These two pivotal situations put AAPL into a spiral through the morning and when the iPad mini price was announced it was widely viewed as being somewhat overpriced and did nothing to help AAPL and AAPL's selling accelerated.  

After the repeated attempts to reverse the stock market selling with weekly charts setups (shown in the upper cluster center row), which have failed, I feel like it is time to take a look at the bond market this evening.  In the lower cluster above, I have two charts of the TLT (20 year bond ETF).  The lower chart is a two year chart of the bonds showing its mother channel where the bonds have tested the lower line of the mother channel twice in the past two months and recovered both times.  Also looking at the two year trendline chart we see that while all the blatant stock market propping was going on the past two months, the bond traders have been quietly building a huge symmetric triangle that I have shown with red lines.   That triangle is tall enough to take the TLT to the upper channel line if it breaks up.

Next, looking at the chart just above it I have a weekly bars chart of the TLT bonds ETF where I have its two key moving averages applied.  I need to stop and mention my moving average coloring system.  I typically use a different set of moving averages for different stocks and indexes as I have found which ones work best for individual symbols.  Nonetheless, I always use red for the smallest moving average and green for the larger moving average ( if i am using four EMAs then blue will be the next larger with pink the largest).

In that chart you can clearly see that when the red EMA gets on top of the green and starts pushing up the bond market roars for a couple of months as can be seen in Aug & Sept 2011 and Apr & May of 2012.  During these same time periods that the bonds were having their two month rallies, the stock market had two month sell offs.  Looking at the two EMAs now, we see that once again the red has been laying on top of the green for a few bars and has come to a tip ready to launch if we have any further weakness in the stock market.  As usual though, if the tip of the red line slips down through the green from any surprise strength in the stock market it will be a technical breakdown in the bond chart and the TLT will fall.

Statistically, a large symmetric triangle sitting on the lower line of a multi year channel has an eighty percent success rate of breaking to the upside if it has an accompanying bullish moving average setup also.  Looking at that triangle closely we can see there are still a number of days of bounce around room before an absolute pivot forces a direction breakout but realize that two thirds of all symmetric triangles break out before they get to the point.

In summary, the bond market has got the place all dressed up ready to invite stock traders over any day now.  Everyone will be watching to see if the stock market proppers try another time or two to save the stock market from a big decline or if yesterday was their last effort in the face of the worst earnings outlook since 2001.

Alan

Monday, October 22, 2012

A Rabbit Out of the Hat

Stock Market Technical Analysis Blog


Click on image to enlarge


Uncle Ben should receive a gold star for the events that took place in the market today.  In this morning's trading the markets continued to sell further down on strong volume but AAPL was driven up at the open and as the morning went on the broad market selling started to slow as everyone came to realize that they were going to drive AAPL up today no matter what it took.  By midday AAPL peaked back above its 108 EMA line shown in the upper cluster, bottom center chart.  As it crossed back above the 108, the entire stock market reversed and a massive short squeeze took all the main indexes all the way back up producing hammer reversal candles on the DOW, S&P, and SPY.

With this dramatic one day reversal the tip of the red line sentiment EMAs on the three indexes in the top row pulled back above the green line to put the bulls back in control.  Looking at the lower cluster, we see that AAPL's rescue turned the SPY and Nasdaq back upward at the lower line of each one's five week descending channel as AAPL ran to the top of its descending channel.

Looking at the three bottom charts, the first shows the hammer reversal candle on the SPY.  The second chart shows the weekly 5/10/20 EMAs of AAPL, and the third chart is a focused in view of AAPL's weekly 5/10 red / green EMAs where we see that these two have come to a fine point as of today's close.  Any movement in either direction from AAPL tomorrow could be the beginning of either an upturn in AAPL or a sudden drop in AAPL because its weekly 5/10 EMAs are to an absolute point now.

AAPL's event conference is tomorrow and the path of least resistance for AAPL will be up.  If it moves up just one dollar we will have a breakout of its five week downtrend channel that should trigger widespread buying programs much the same as Friday's action triggered widespread selling programs.

If AAPL can't break out of its downhill channel tomorrow and starts another wave down inside that channel then it could suffer a serious blow as a fall from where it is at would cause the weekly 5 to cross down through the 10, something that hasn't happened in over a year.


Alan

Friday, October 19, 2012

Sell Programs Triggered

Stock Market Technical Analysis Blog

Click on image to enlarge


Before anyone reads tonight's blog they should scroll down and read my Monday Oct 15th blog where I discussed that they must keep the market moving up this week and next week and if they had just one day of selling it could collapse everything as I explained it in detail in that blog.

Looking at the top row above, we see that the carefully executed red/green sentiment EMAs bounce at the beginning of this week was not kept going as was required to enable the week red/green 5/10 EMAs line bounce to start in the weekly charts in the second row above.  This lack of follow through triggered other events the first being the VIX in the top right corner chart which had its red line cross above its green that I mentioned several times would trigger widespread sell programs if it was allowed to happen.

Looking at the second row we can see that after today's selling we have a situation where if Monday's open is down and the market closes down, we will have a confirmed weekly bars red/green 5/10 down cross in AAPL, Nasdaq, and QQQ instead of the 5/10 line bounce they have been pushing hard to get started.  Looking at the bottom row we see that AAPL's blue / pink 20/50 down cross also was triggered today as I discussed in Wednesday's blog.  In the center chart of the bottom row we see that all these cascading events caused AAPL to slip through its red 108 EMA line, the great bull/bear line in the sand for all stocks and indexes.  In the last chart of the bottom row, the last result of these cascading triggers happened as the VIX broke out of its five month downhill channel and closed well out of it.

Oh Ben, where art thou?

Alan

Thursday, October 18, 2012

The Writing Was On the Wall

Stock Market Technical Analysis Blog

Click on image to enlarge


In the markets today GOOG got crushed from a big earnings miss (nevermind the fact that it was released early, an afterhours release would have gotten the same effect).  On September 28th I called out that a major Wall Street firm exited GOOG as a heads up for anyone who was in it.  No major Wall Street firm exists GOOG two weeks ahead of earnings unless they know something.  GOOG is their number two baby behind AAPL.

I got some unhappy emails after calling that out but the fact is over the past two weeks there has been a steady flow of Wall Street exit trades as earnings approached.  We all know that when Wall Street exits its long positions it goes short.  I hope the Sept 28th post saved some of my readers today's grief in GOOG.


Alan

Wednesday, October 17, 2012

Sentiment EMAs Lifting

Stock Market Technical Analysis Blog

Click on image to enlarge


After three days of upward movement in the market we can see the red EMA lifting on the DOW, S&P, and SPY shown in the top row of the daily charts above.  In the fourth chart of the top row above we can see that the first three charts have produced enough lift to keep the red EMA on the VIX from crossing to the top side - an event that will kick the market into sell mode.  As I mentioned in Monday's blog they had to keep the sentiment EMAs rising this week and next week in order to produce confirmed lift in the weekly 5/10 EMAs shown in the middle row above.

So far so good, the upward movement has continued three days in a row which is something that hasn't happened in a while.  Yet there is a pink elephant in the room that everyone is trying to ignore but all eyes should be monitoring AAPL's breakdown shown in the bottom chart.

Yesterday AAPL's price bar hit resistance at the merged pink 50 and blue 20 EMA lines.  Today AAPL's price was not able to break above the two and dropped back down.  This is a huge pivot point for AAPL.  If they can jam AAPL here over the next several days it will produce a blue 20/ pink 50 layup which was what produced the June through September rally.  If AAPL loses it here it will have a blue 20 / pink 50 down cross which could easily take AAPL down to last June's prices.  They have two, maybe three days to get their act together on AAPL and make the 20/50 lift start happening.  If they cannot pull it off, well heeled shorts will be shorting AAPL with both hands and both feet.

Alan


Monday, October 15, 2012

Sentiment EMAs & Weekly Charts Coming Into Play

Stock Market Technical Analysis Blog

Click on image to enlarge


Tonight I am focusing on just the most critical charts.  The top four charts are daily charts of the sentiment EMAs on the DOW, S&P, SPY, and VIX.  Last night I discussed the make or break situation that these top four charts had as their sentiment EMAs merged to a point.  I also discussed that if the market went south today the red EMAs would pierce down through the green on the DOW, S&P, and SPY which would cause the VIX to have its red line cross above its green line which would be a huge sell signal.

At 3AM this morning we had an intervention and the SPY started trading at a considerably higher level because of the economic and CitiBank news that would come four hours later.  Once the regular session opened the squeeze was on.

Looking at the DOW, S&P, and SPY charts in the top row tonight we can see that today's squeeze was enough to pull the red just slightly above the green on the DOW and S&P and prevented the red line on the SPY from piercing down through.  In the fourth chart of the top row we see that today's market action also kept the VIX from having its red line cross above its green line which would have caused a widespread sell off.  Preventing the red / green down cross in the three indexes shown keeps the sentiment bullish at least for the time being.  The real story though of what they are trying to make happen is shown in the four lower charts posted above.

These four charts are weekly bars charts with the traditional 5/10/20 and 50 EMAs.  Looking at these which are AAPL, SPY, Nasdaq, and QQQ we see that they all are setup nicely for a multi-week leg up in the market  as each one's red / green 5/10 lines are trying to start a layup line bounce while at the same time three of the four have found price support at their blue 20 EMAs with last week's bar.  If they keep pushing this market over the next week it will produce another line bounce in the sentiment EMAs which will stop the selling and cause the four weekly charts to start lifting with another weekly 5/10 leg up in the market.

The key for them to have success in producing another weekly chart leg up in the market, after having recently reached an overextended peak, is follow through.  They cannot expect just scaring the shorts will sustain a multi-week rally.  They have to be in there every day preventing the small intraday pivots from breaking downward so that the slow moving weekly EMAs continue to climb.  This is a setup that two month rallies typically use to lift from.  What will be working against it is the tremendous amount of overhead that is present at the market peak four weeks ago.  If they can't keep it going this could easily morph into the first bounce on the downward backside of an overextended market peak.  Now that so many EMA lines have merged it has created a double edged sword situation.  If they can continue driving it upward it could be a strong rally but if they let up anytime during this week or next while the red / green EMAs are still compressed together they would be risking one ugly selling day's ability to pull the tip of the red EMAs below the green line and trigger cascading selling.

Alan

Sunday, October 14, 2012

Sentiment EMAs

Stock Market Technical Analysis Blog

Click on image to enlarge


 In this weekend's blog I will post some charts showing what is called the Sentiment EMAs.  These two exponential moving averages are widely used in the industry as turning points for when a stock is either sent to the doghouse or comes back into play.  When the smaller red EMA is above the larger green EMA, the stock or index is considered midterm bullish and when the the red is below the green it is considered midterm bearish.

Looking at the center row first, we see that the Nasdaq slipped below a couple of days ago and the QQQ slipped below at the beginning of the week as did AAPL.

Looking at the top row next, we see that the DOW is still topside but barely.  In the next chart the S&P has the two lines merging.  In the third chart, the SPY is in danger of down crossing at the open on Monday.  As is the IWM (Russell 2000) shown in the last chart.

The bottom row are four widely held symbols which all are still in bullish territory.

I red highlighted the borders of the SPY and VIX chart as they are the most crucial for Monday.  If Monday's market open is negative, the SPY could have its red line cross down below the green for the first time in four months and the VIX could have its red line cross above the its green, an event that triggers automated sell programs both with hedgefunds and institutions.  If Monday's open is up, the SPY and the VIX  may continue to hold merging to a point and require another day or two to determine direction.


Alan

Thursday, October 11, 2012

Gap and Drop

Stock Market Technical Analysis Blog

Click on image to enlarge


In the market today, the powers behind the curtain tried to force the pivot discussed in last night's blog to the upward direction with a big gap up shown in the intraday charts at the right side above.  They weren't able to find any buyers at the level they opened it up at and the entire market sold back down giving the entire gap back.

In the first hour of the market this morning the red/blue 5/20s and the red/pink 5/50s I discussed last night were starting to turn up but as the day wore on the tip of each one's 5 EMA line was pulled down through its larger EMA on all the indexes shown in the first two columns above.

This market wants to see the indexes traded up not gapped up nor gapped and short squeezed.

Alan

AAPL and big picture charts below


Click on image to enlarge

Click on image to enlarge

Click on image to enlarge

Wednesday, October 10, 2012

Huge Pivot Situation Tomorrow

Stock Market Technical Analysis Blog

Click on image to enlarge

In the market today AAPL reversed with a $5 bounce using the technicals discussed in last night's blog, even though there was heavy selling in all the major indexes.  Now AAPL is quite capable of breaking out of its downtrend tomorrow if the major indexes use the technical setups they have tonight to lift tomorrow.

Looking at the charts above:

  • top left and middle charts (Nasdaq & QQQ) are both setup to start a red /pink 5/50 bounce tomorrow
  • charts below those (S&P 500 & SPY) are set up ready to begin a red/blue 5/20 bounce tomorrow
  • below that the DOW is also setup at the red/blue 5/20 juncture
  • to the right of it AAPL is set to start a green /pink 10/50 bounce tomorrow
As these setups developed today, the VXX (VIX Futures) shown in the right side center chart, found resistance at the blue 20 EMA and the dreaded red/green 5/10 VXX up cross did not happen.  

All of this together we have a huge pivot situation, either these 5/20 and 5/50 juctures will bounce or pierce down through by the end of the trading day tomorrow.  It is really quite a large pivot that could establish a trend for the next week or so.  If these EMA junctures do pierce down through instead of bouncing it will cause the VXX to have a red /green 5/10 up cross which would trigger widespread automated sell programs.

Alan

AAPL & big picture clusters shown below:

Click on image to enlarge

Click on image to enlarge

Click on image to enlarge

Tuesday, October 9, 2012

AAPL Reversal Attempt Tomorrow

Stock Market Technical Analysis Blog

Click on image to enlarge

After another nasty day of selling in the markets AAPL finally has a good chance for a bounce tomorrow.  

Looking at the four charts above: 
  • the top left corner chart shows that AAPL printed a bullish reversal candle today 
  • the right corner chart, the five month chart of 120 minute bars of AAPL, we see that AAPL is attempting to turn back up on the lower line of its number four channel (number four of seventeen if you have them all drawn).  
  • In the lower left corner chart, we see that AAPL found support at the 108 EMA its favorite reversal point.  
  • In the bottom right corner chart, AAPL found support on the topside of the 84% Fibonacci retracement level off the April to mid May decline.  
If AAPL pulls off the bounce tomorrow it will be just in time for the S&P 500 as is shown in the middle cluster below, where we see that the S&P 500 is about to fall out of its five month uphill channel and directly below it the VIX is about break out of its five month downhill channel.


Alan
AAPL & big picture clusters below:


Click on image to enlarge

Click on image to enlarge

Click on image to enlarge

Monday, October 8, 2012

AAPL Drags Rally Back Down

Stock Market Technical Analysis Blog

Click on image to enlarge


Following up from Thursday night's blog, where I mentioned the rally could keep going as long as AAPL didn't get heavy from its technically broken chart, AAPL ended up dropping hard Friday and today brought the entire market down with it.  The Nasdaq took the biggest hit over the past two days and the S&P damage is also substantial.

In the chart posted above, the fifteen month daily bars chart of AAPL, we see that over the past two days AAPL has dropped out of its one year up channel just about as much as it did back on July 25th.  On July 27th, Wall Street stepped in and caused a fierce short squeeze which put AAPL back into its channel and on to 700.  The question now is will Wall Street be able and willing to rescue AAPL again in light of the widespread view that most companies earnings will be weak this time and may cause AAPL to experience "sell everything" selling if broad market selling kicks in.  If Wall Street doesn't step in tomorrow AAPL's mother channel currently in the 475 to 525 range is going to start working as a magnet.  How AAPL behaves may very well reflect how earnings come in on the rest of the tech giants.

Alan
AAPL & Big Picture clusters shown below:


Click on image to enlarge

Click on image to enlarge

Click on image to enlarge

Thursday, October 4, 2012

Day 2 of Market Lift

Stock Market Technical Analysis Blog

Click on image to enlarge

Following up from Tuesday night's blog where I mentioned that Bernanke should take advantage of an exceptional opportunity that was set up in AAPL for him to use it to change the market's current pivot to the upward direction which was what he actually did yesterday.  Also following up from last night's blog closing sentence discussing the -145 Advance Decline left lots of room for Bernanke to spread the rally to the full breadth of stocks over the next couple of days which is what he actually did today.  

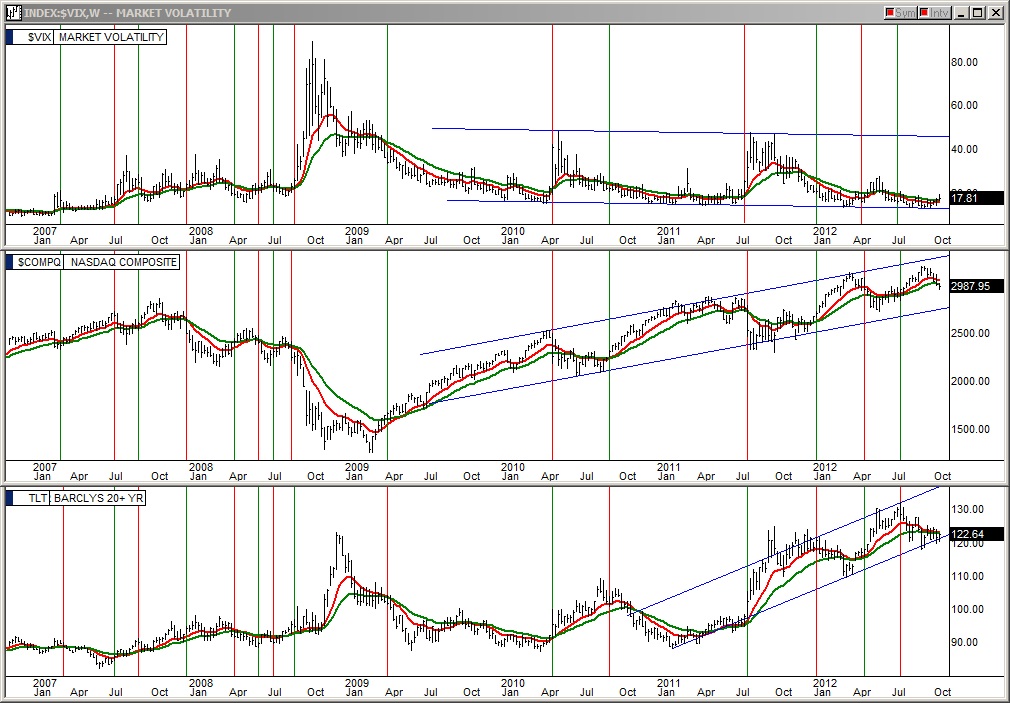
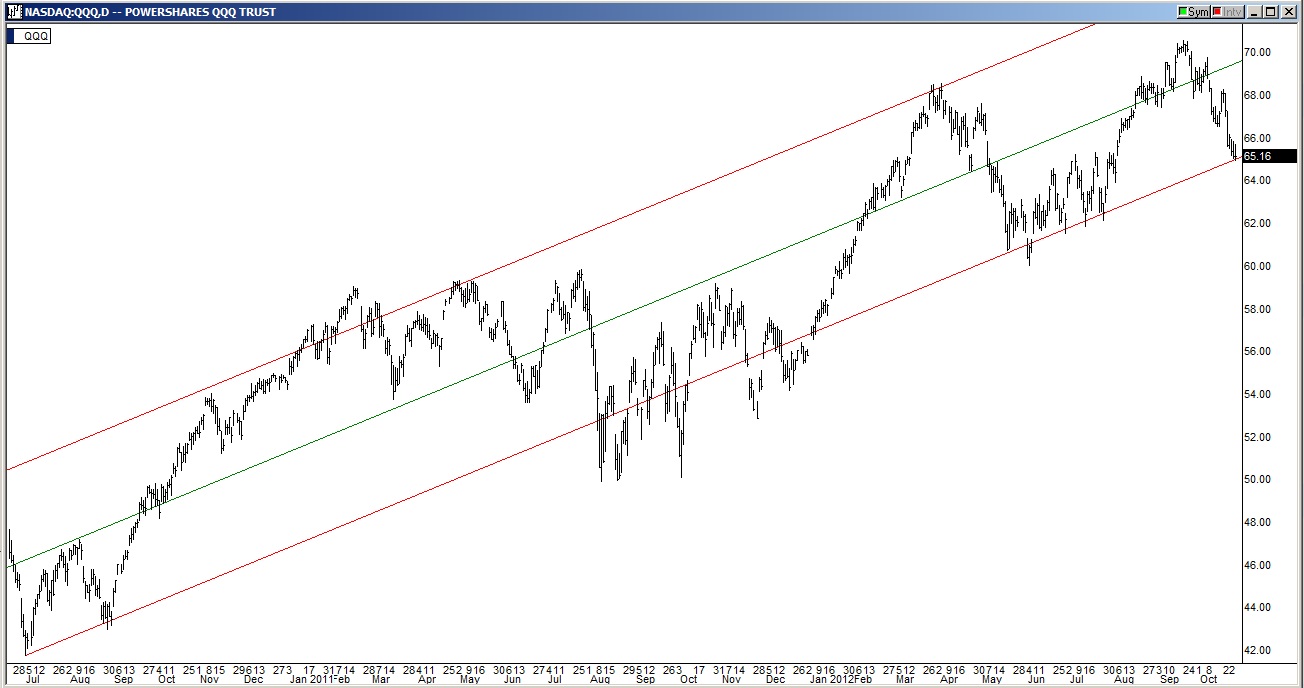
This lift he has created by taking these two steps is showing up on all the major indexes now as shown in the charts above.  In the left column, the Nasdaq and SPY, we see the smooth gradual red / blue 5/20 EMA layup beginning.  In the bottom left corner, we see the DOW's red/green 5/10 EMA layup beginning.  In the center column, the S&P 500 and Russell 2000 (IWM Russell 2000) have their red/blue 5/20 EMA layups beginning.  Below the IWM Russell 2000 we see the QQQ which lost it several days ago mainly because of AAPL's funk but its 5 EMA has managed to claw its way back up on to the blue 20 EMA line and start lifting.  

In the far right column the VIX (Volatility Index), VXX (VIX Futures), and the UUP (Dollar Index) are turning substantially downward now, a  reflection of the strength of the 5/20 layup starts that Bernanke has crafted over the past two days hitting AAPL hard the first day and then shifting the push to the full breadth of stocks today.

The daily 5/10/20 EMAs of all the indexes now have bullish setups that are just about as high quality as they get.  The only thing keeping us from a follow through into several days of rally here would be if AAPL starts to get really heavy again.   AAPL's charts are shown in the cluster below and we see that its price could not break up through the blue 20 EMA line in the top left chart of that cluster where it also found resistance yesterday afternoon.  This AAPL situation must be monitored closely since if it were to worsen, AAPL could tip the punch bowl over by itself.

Alan
AAPL & Big Picture Clusters shown below:


Click on image to enlarge

Click on image to enlarge

Click on image to enlarge

Wednesday, October 3, 2012

Bernanke Pounces on the Setup, AAPL +$10

Stock Market Technical Analysis Blog

Click on image to enlarge


Following up from last night's blog, Bernanke's team did indeed see the easy setup on AAPL and took it right from the open giving an easy $10 on AAPL to anyone who was watching for it to start at the open this morning.

By doing so, Bernanke changed the pivot direction on the Nasdaq and SPY shown in the left side top two charts above.  AAPL's move also started pulling the VXX (VIX Futures) slightly downward in the top center chart above.  This market intervention also made a nice shift in the on balance volume divergence on the SPY with a +100k shares of net buying shown in the second chart from the right above.

If Bernanke's team refuses to let up now that they have a direction change started, this could easily be the termination of a nasty correction that was about to begin.  Hopefully they will follow through  and take advantage of the fact that they have the shorts in a panic right now and with a closing Advance Decline of -145 there is a world of room above for the rest of the stocks to run the next couple of days.

Alan
AAPL and Big Picture clusters updated below:


Click on image to enlarge

Click on image to enlarge

Click on image to enlarge

Tuesday, October 2, 2012

Bernanke Has Big Opportunity Tomorrow

Stock Market Technical Analysis Blog

Click on image to enlarge


There was almost no change in the EMA charts of the Nasdaq, SPY, and AAPL shown above from last night to tonight.  The Nasdaq & SPY are at a pivot and are holding there.  The VXX at the center upper chart is still stuck with its 5/10 going sideways.  The AAPL did get the obligatory bounce in the bottom left corner chart above which produced a hammer reversal candle that is shown in the lower center chart above.

Bernanke's team will be hard pressed to get a better setup to take the market up tomorrow by using AAPL's reversal hammer candle on its 50 day EMA line as the driving force.  Also the wind will be at Bernanke's back tomorrow as AAPL has developed a nice week wide on balance volume push divergence as shown on the far right chart above.

If tomorrow is Bernanke's big day in the stock market, it will be just in time for as we can see in the SPY on balance volume chart above, second from the right, that even though the SPY has trended up for the past five days we still have had a deluge of net selling as the blue on balance volume line continues to plummet indicating people are running for the exits in droves.  

Alan

AAPL & Big Picture Clusters Below:


Click on image to enlarge

Click on image to enlarge

Click on image to enlarge

Monday, October 1, 2012

Indexes On Verge of Technical Breakdown

Stock Market Technical Analysis Blog

Click on image to enlarge


In the stock market today we had one of the most convoluted price action days that we have seen in a while.  Looking at the upper right side charts first, the 120 minute bars charts of the Nasdaq, SPY, and AAPL, we see what happens when a symmetric triangle is trying to break lower but is forced upwards.  At the open they jammed all three to try to start the triangle play to the top side but it wasn't long before sellers came in heavy and reversed it all.

Looking over to the left side charts above, the daily EMA charts of the Nasdaq, SPY, and AAPL we see that the red/blue 5 EMA / 20 EMA line bounce that I have mentioned that they have been trying to set up for the past couple of days is in trouble as of today's close.  AAPL actually had the 5/20 do the down cross today (but could get the obligatory price-50 bounce tomorrow but the EMAs are now bearish) and will be considered a broken chart for a few days.  The SPY popped nicely but gave it all back.  Yet its red 5 is still topside of its 20 but barely.  The Nasdaq if you look closely actually had its 5 line begin piercing down through the blue 20 line as of today's close.  You have SPY being neutral, Nasdaq slightly bearish, and AAPL very bearish.

Looking at the VIX Futures (VXX ETF) we see that red 5 still going sideways with the green 10.  If the red 5 crosses above it will trigger widespread automated sell programs to kick in.  Technically the VXX is holding sideways too long to be able to turn back down now but you've got to believe that Bernanke's team is circling the wagons tonight and preparing for a better show tomorrow hopefully enough to reverse these breakdowns that are starting.  If they don't we could have sell signals across the board on all the indexes and key stocks quickly.


Alan
AAPL Cluster & two Big Picture Clusters are updated below:

Click on image to enlarge

Click on image to enlarge

Click on image to enlarge

Blog Archive