Stock Market Viewpoint

Stock Market Viewpoint
Reading the Tea Leaves...

Wednesday, October 30, 2013

Prop-toberfest Winding Down

Stock Market Technical Analysis Blog


Click on images to enlarge


In the market today we saw the end of the powerful 5-day tractor program that Ben had clamped down on the market, forcing it to trade in a narrow tube slightly upward as seen in chart 1 above. It served him well by getting the market as high as possible even though we were at the upper channel line a week ago to put some cushion below the current level in case the market reacted severely to his change in rhetoric to a less dovish stance which is in a way a bit of relief as it appears now that at least there really was a purpose for the 5-day tractor program and not the beginning of a dangerous bubble (at least let's hope not).

Taking a look at the charts above:
  1.  7-day intraday chart of SPY showing 5-day tractor program that was turned off at the open today
  2. 120min bar chart of VIX showing two very large EMAs that are notorious for triggering major selloffs when the red EMA crosses above the blue EMA or bounces up from the blue EMA.  We closed with the two merging at a point
  3. Day candles of SPY showing today's selloff
  4. Week candles of SPY showing a topping shooting star as of this evening
  5. SPY managed to close right at its orange EMA 
  6. VIX shows big jump at the open today
  7. SPY not down to its upper channel line yet
  8. VIX trying to break out of its orange sideways channel
  9. SPY dropped considerably today
  10. VIX re-energized after consolidating at lower channel line
  11. SPY still ridiculously overextended from its 100 day EMA
  12. SPY momentum fading as major lift appears to be done
  13. SPY selloff agrees with upper float turnover line and shows it is still away from the 15 EMA line
  14. SPY ADX - shows the expansion between the positive and negative line is now contracting 
  15. SPY shows it is still well up in its 5th Gann ray sector and the MACD below it is starting to show some fast line closure
  16. SPY is still well out of the congestion of the traditional large SMAs
  17. SPY closed right at the line over from last week's spike
  18. SPY Fibonacci - will take a couple days of selling before I post another Fibonacci set from the top down.  Also, note the huge red spike in volume today after volume had declined steeply for three weeks 
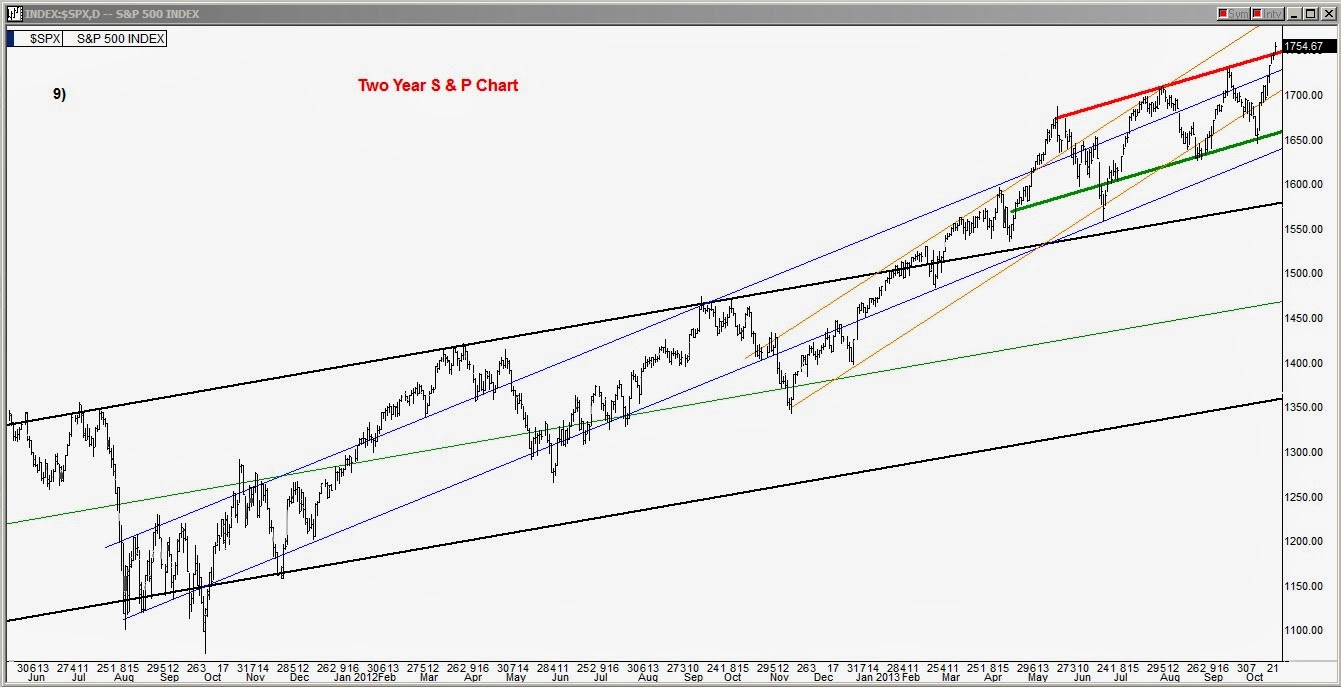
  19. SPY 2-year chart shows it is still above the steeper two year blue line secondary channel
  20. 25 year chart of S&P
  21. 2-year chart of NASDAQ - a very important chart to examine tonight as the Nasdaq has been climbing from its lower channel line to its upper for an entire year and is now stalling at the upper line.  Well known that it has been the leader for the bullish sentiment
  22. 2-year chart of DOW showing it is at its upper line of its horizontal blue channel

For the next couple days Chart 2 above will likely be Ben's greatest concern if the red line starts lifting above the blue line because then real trouble starts for the market as can easily be seen with its previous line junctures.

Trade well my friends

Alan

Thursday, October 24, 2013

Bears Sniffing the Air, Looking A Little Confused

Stock Market Technical Analysis Blog


click on image to enlarge


In the market today we had a slightly up day as the sideways propping continued that I mentioned I was expecting this week in Monday's blog.  It's been a bit more than propping though as they clamped down a tractor program on the market yesterday that has kept the S&P in a very narrow almost straw-like tube for two days, effectively locking down the market right where it's at.

While we are still lower than we were on Tuesday, more than a few eyebrows were raised this afternoon as the VIX started drifting downward with the SPY still right at the upper channel line after dropping below it yesterday.  What Ben & Co have planned for their parting hurrah is anyone's guess, however, since the initial drop at the first of the week we are in a slight uptrend these last two days.  The bears are no doubt watching this closely somewhat confused as the VIX should be climbing higher as the market goes sideways, the common prelude to an upcoming decline to the lower channel line on the S&P.

Taking a look at the charts:
  • Chart 1:  Daily candles - another slightly bullish hammer today but with no multiday decline in front of it, it is obviously manipulation
  • Chart 2:  Weekly candles - yesterday's shooting star formation is starting to have the body fill in today as it approaches the possibility of becoming a neutral candle by tomorrow night
  • Chart 3:  yesterday's orange line support was what gave the market some modest upward movement today
  • Chart 4:  yesterday the VIX had freshly crossed above its orange EMA line looking to climb higher but today we see that it dropped back below it, an afternoon victory for the bulls
  • Chart 5:  60 min bar chart of the SPY - while we haven't regained the blue ascension channel we are back up and slightly above the upper red channel line
  • Chart 6:  60 min bar chart of the VIX - the 3 day uptrend was breached as the VIX slipped below its 3 day orange channel
  • Chart 7:  shows the SPY has moved back up today to exactly its upper channel line
  • Chart 8:  shows the VIX starting to decline today
  • Chart 9:  shows the SPY is extended away from its 100 day EMA line, about as far as it ever gets away from it and also shows the still steadily decreasing volume 
  • Chart 10:  the major lift EMAs have done their job once again
  • Chart 11:  the SPY is positioned well above the congestion of the large traditional SMAs
  • Chart 12:  shows how yesterday's low got support from the line coming across at the Bernanke no taper speech pop
  • Chart 13:  we are far from having a major Fibonacci line come into play
  • Chart 14:  the two year chart of the S&P showing how it has bubbled out of its primary black line channel
  • Chart 15:  the 25 year chart of the S&P showing we still have another 2-4 months in the current 5 year supercycle
Looking forward we could easily enter uncharted territory here and see all rules and logic being thrown out the window.  Maybe not but it's something to keep in mind.

Trade well my friends

Alan

Wednesday, October 23, 2013

Sasquatch Strikes Back

Stock Market Technical Analysis Blog


click on image to enlarge

Sasquatch, the monstrous short interest, was out feeding early this morning and took a healthy bite out of the bulls.  Not a major wound yet as the bulls are still standing.  Considering the fact that Ben & Co are within 90 days of flying the coop and they will likely have to walk off with the QE waterhose laying on the ground running full force, I am expecting lots of market propping every chance they get.  Ben will likely want the market to be at an all time high as he exits but between now and then it could be choppy and all over the place.

Taking a look at the charts:
  • Chart 1:  No clear short term direction yet but today's low did find at least temporary support at the orange EMA line
  • Chart 2:  60 min bar chart of the SPY showing the short term ascension channel that we fell out of today but not that far as there was plenty of propping in the afternoon
  • Chart 3:  Weekly candles - is showing a topping shooting star at midweek but we have to see how it closes Friday night
  • Chart 4:  Daily candles - we have a hammer reversal candle today - caution - no guarantees as there is contradition between the weekly and daily candle and there hasn't been enough down trading days in front of today's hammer to give it much strength for reversal
  • Chart 5:  60 min bar chart of the VIX showing its short term descending channel, note it continued its uptrend for the third day
  • Chart 6:  shows the SPY dropped back down below its upper channel line
  • Chart 7:  shows the VIX is building a base at its lower channel line
  • Chart 8:  shows the SPY is extended away from its 100 day EMA line, about as far as it ever gets away from it and also shows the steadily decreasing volume as the rally went higher
  • Chart 9:  the two year chart of the S&P showing how it has bubbled out of its primary black line channel
  • Chart 10:  the 25 year chart of the S&P showing we still have another 2-4 months in the current 5 year supercycle

Trade well my friends

Alan

Tuesday, October 22, 2013

Messing With Sasquatch

Stock Market Technical Analysis Blog


click on image to enlarge

In the market today, Wall Street decided there was no need to pull the plug on the party just yet as they undertook a champagne celebration short squeeze based upon the fresh evidence of a worsening job market and QE possibly indefinitely.

Early on they decided it would be fun to mess with sasquatch, the monstrous short interest that shows up at the perfectly defined upper channel line.  Squeezing out of the channel in itself is fine as long as you remember that sasquatch can be really sneaky and likes to feed in the early morning hours (premarket session) when most people can't exit their positions.

Taking a look at the charts:
  • Chart 1:  I'm not chasing a short squeeze above an upper channel line
  • Chart 2:  60 min bar chart of the SPY showing the short term ascension channel
  • Chart 3:  Weekly candles - has an indecision candle
  • Chart 4:  Daily candles - also has an indecision candle again today
  • Chart 5:  60 min bar chart of the VIX showing its short term descending channel, note it continued its uptrend today despite the bad jobs report celebration in the market
  • Chart 6:  shows the SPY reached its upper channel line last Friday
  • Chart 7:  shows the VIX dropped to its lower channel line last Friday
  • Chart 8:  shows the SPY is extended away from its 100 day EMA line, about as far as it ever gets away from it and also shows the steadily decreasing volume as the rally went higher
  • Chart 9:  the two year chart of the S&P showing how it has bubbled out of its primary black line channel
  • Chart 10:  the 25 year chart of the S&P showing we still have another 2-4 months in the current 5 year supercycle

Trade well my friends

Alan

Monday, October 21, 2013

S&P Stalls At Upper Channel Line

Stock Market Technical Analysis Blog


click on image to enlarge


In the market today we had a flat closing as the S&P turns sideways at its upper channel line.  
  • Chart 1:  I closed the SMV model portfolio trade today for a 4 percent gain from the line cross entry.
  • Chart 2:  60 min bar chart of the SPY showing the short term ascension channel
  • Chart 3:  Weekly candles - has an indecision candle
  • Chart 4:  Daily candles - also has an indecision candle
  • Chart 5:  60 min bar chart of the VIX showing its short term descending channel
  • Chart 6:  shows the SPY reached its upper channel line last Friday
  • Chart 7:  shows the VIX dropped to its lower channel line last Friday
  • Chart 8:  shows the SPY is extended away from its 100 day EMA line, about as far as it ever gets away from it and also shows the steadily decreasing volume as the rally went higher
  • Chart 9:  the two year chart of the S&P showing how it has bubbled out of its primary black line channel
  • Chart 10:  the 25 year chart of the S&P showing we still have another 2-4 months in the current 5 year supercycle
With the S&P now at the upper channel line, I feel there is a pretty good chance they will keep it sideways and choppy at that line for a few days to put a little more lipstick on the debt extension.


Trade well  my friends

Alan

Friday, October 18, 2013

Partying Like It's 1999

Stock Market Technical Analysis Blog


click on image to enlarge


We've had an amazing week of stocks just running and running, you could pretty much say we have been partying like it's 1999.  However, taking a look at where the SPY is at in its channel (chart 1) and where the VIX is at in its channel (chart 2) and how far we are extended from the 100 day EMA line (chart 3) it might not be a bad idea to start thinking about calling for a taxi ride home soon.  

Trade well my friends

Alan

Wednesday, October 9, 2013

Mixed Close, No Washington News

Stock Market Technical Analysis Blog


click on image to enlarge

In the market today we had a mixed close without any meaningful news on the Washington situation.  Nonetheless, they went with the Yellen appointment to try to move the market up after a brief drop at the open.  During the middle of the day and early afternoon, we were looking good for a reversal day but in the last thirty minutes the market turned and rolled over as the VIX decided to stay in its steep blue line channel shown in the middle cluster, lower chart.

Today's candle showed that the market was trying to reverse and sometimes it can go sideways at the lower channel line for a number of days before actually starting a move back up as can be seen in the upper chart cluster, chart 4.  The bulls like what happened today but not enough to hold overnight which caused the last thirty minutes exit frenzy.  

Trade well my friends

Alan

Tuesday, October 8, 2013

Selling Intensifies

Stock Market Technical Analysis Blog


click on image to enlarge


In the market today we had a serious sell off that has brought the S&P to a major decision point tonight - the lower line of its summer channel as seen in the top cluster, chart 4.  Also, in the top cluster, the SPY is down to its 100 day EMA, the dividing line between midterm bullish and midterm bearish market conditions shown in chart 3.  It is important that they defend the lower channel line and the 100 EMA line tomorrow because a meaningful break of those two will likely send the market into a spiral for a few days.  I was looking for them to bring out some sort of positive Washington development yesterday or today that they could use to start a short squeeze but nothing was ever offered.  After hours, however, a Yellen appointment was leaked and they juiced the Futures up about 10 points quickly.  Her appointment was something the market was already assuming and in itself would be a lame cut and paste news for a short squeeze but since there are no other positive developments out at this hour anyway, it looks like this is what they are going to use to try to start a short squeeze tomorrow.  The sustainability of a short squeeze off this type of news is questionable.

Looking at the middle chart cluster, we see the S&P broke through another major diagonal support line today and also the VIX popped into the really steep blue channel that can easily wreak havoc on the market.  These are both big reasons why they must play their cards for starting a short squeeze tomorrow even though they don't have the right ammunition.

Looking at the bottom chart cluster, the upper chart is the long term chart of the S&P which really makes it clear the size of the bubble they have pumped up in recent months as the S&P could fall a full 300 points and still be in its very bullish long term uphill black line channel. Also below that chart is a longterm chart of the VIX showing an alternate long term major channel.

Trade well my friends

Alan

Friday, October 4, 2013

VIX Testing Upper Channel Line

Stock Market Technical Analysis Blog


click on image to enlarge


In the market today we had a decent up day as we had a classic low volume Friday float up.  The key situation tonight is with the VIX (lower chart above) where we see it is in the process of testing its upper green channel line.  Yesterday, it broke above it briefly and retreated but failed to drop out of the ascending blue channel line today and it actually closed right at the lower line of the blue channel much the same as the SPY inversely closed at the upper line of its blue channel.

Monday morning will be critical.  If they can come up with genuinely positive news to offer on the Washington situation on Monday it could trigger the VIX's blue channel breakdown which would cause the SPY to break up out of its blue channel.  It will have to be genuinely positive and meaningful news though because if they pre-package something lame as a positive development on Washington the market will likely spit it out and continue downward.

Trade well my friends

Alan

Thursday, October 3, 2013

As The Cookie Crumbles

Stock Market Technical Analysis Blog


Click on image to enlarge


In the market today we had a pretty serious down day as the blue channel in chart 2 continues to take us lower.

Trade well my friends

Alan

Wednesday, October 2, 2013

Drop and Squeeze...Again

Stock Market Technical Analysis blog


click on image to enlarge


In the market today we had a slightly down day as we dropped at the open then squeezed part of the way back up.  Benny is trying to sell a breakout of the downhill blue line channel in chart 2 using the roughly crafted red line channel also shown.  Any takers?


Trade well my friends

Alan

Tuesday, October 1, 2013

Govt Shut Down...Squeezorama

Stock Market Technical Analysis blog


click on image to enlarge


In the market today we had a fairly strong up day as the government shut down and a million government workers laid off.  Hey...why not rally?  

Looking at chart 2 above, today's short squeeze tried to break us out of the downhill blue channel in the last thirty minutes.  Squeeze away Benny...

Trade well my friends

Alan