Stock Market Viewpoint

Stock Market Viewpoint
Reading the Tea Leaves...

Monday, October 31, 2011

Late Evening Trendline Charts Update 10/31/11


Stock Market Technical Analysis Blog


Click on images to enlarge

Midday Trendline Charts Update 10/31/11

Stock Market Technical Analysis Blog


Click on images to enlarge

The push to keep the stock market as high as possible right up until 3pm today which is the end of the current monthly bar.  Hopefully starting tomorrow the market will resume natural trading after a few days of very persistent propping. 

Alan

Please see risk disclaimer below

Thursday, October 27, 2011

Midday Trendline Charts Update 10/27/11

Stock Market Technical Analysis Blog

click on above image to enlarge

In the above chart set the bonds have finally broken down thru the pink  Day 50 EMA line on the European agreement news.


click on above image to enlarge

In the above chart set the NASDAQ is approaching its upper 3-month channel line as the TLT is at its lower 4-month downtrend line.


click on above image to enlarge

In the above charts the SPY and DOW are doing most of the work the past few days as they still have plenty of room left in their uphill blue channel.


click on above image to enlarge

In the above charts we see a breakdown in the VIX today and the dollar returning to trading in its longterm slightly downhill channel.


click on above image to enlarge

In the above chart the most noteworthy item is that the QQQ has reached its upper blue channel line which has been quite restrictive the past two weeks.


click on above image to enlarge

In the above charts the Advance Decline has just pegged the upper red line showing extremely short term overbought.


click on image to enlarge

In the above chart set we see that today is a big day for the DOW and S&P as they both have re-entered their mid-year horizontal black line channels.  The TLT, UUP, and VIX are all three at the lower line of their downhill channels at this hour.  Most noteworthy is the VIX which is also catching support at the lower line of its longterm, slightly uphill, black line channel. 


click on image to enlarge

In the above set we see that the right side monthly bars charts have their fall rally lift well under way now. 
Alan
Please see risk disclaimer below

Tuesday, October 25, 2011

It's All About the QQQ Tonight 10/24/11

Stock Market Technical Analysis Blog


Click on image to enlarge


In the markets today we had excellent follow thru from Friday's closing hour setup giving us a huge rally this morning and much to the short's surprise they held the peak sideways for the rest of the day.  I just have time to post one chart tonight and discuss it so the most important one by far is the QQQ. 

The lower chart above is the daily chart of the QQQ and the upper chart has two hour bars.  Looking at the lower chart first we see that today's close stopped at the junction of four major channel lines.  It stopped at the upper line of the one year horizontal black line channel which is also the upper line of the 2 1/2 month uphill blue channel and is also the lower line of the 1 year orange uphill channel and also, the lower line of the uphill brown line channel.

Looking at the top chart above, the more focused in 120 minute bar view we see the QQQs trading the entire afternoon holding right at the junction of these four major channels.  This is extremely rare to have a pivot at the intersection of four major channels.  We are at a pivot point that could be very volatile, if not explosive here.  This is it for the bears, if they can't break this down tomorrow they will end up getting squeezed out of their last dollars in very short order.  The stakes are equally as high for the bulls, they have dressed this market up and driven it to the prom and the dance is ready to start.  The PPT just cannot get cold feet now and decide they've done enough.

Alan

Please see risk disclaimer below

Friday, October 21, 2011

End of Day Trendline Charts 10/21/11

Stock Market Technical Analysis Blog


click on image to enlarge


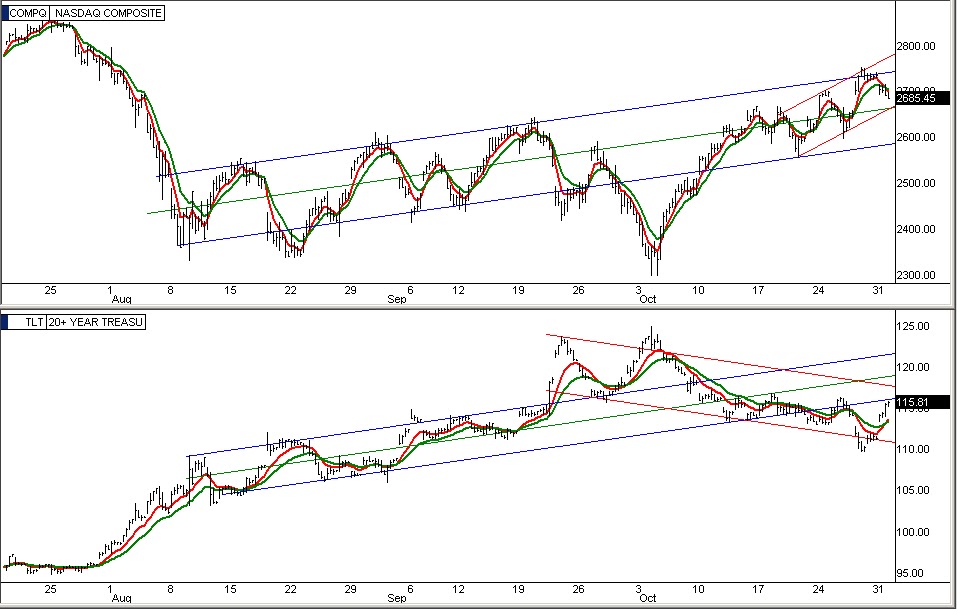
In the above chart set the stock market is set up and ready to begin stage two of the fall rally.  Back at the open on 10/5, I discussed that there was a major intervention happening in the stock market to stop the perilous fall that was imminent at that point.  On the two blogs I posted on 10/10, I discussed how that date should be the marker for the official beginning of the fall rally.  Since then the NASDAQ has climbed well above its 50 Day moving average and out of its Aug/Sep trading range and has come back down to retest the pink 50 EMA and also the blue Day 20 EMA as shown in the top chart.  After yesterday's retest of both key lines the market gapped open today back above the 5 EMA then sold back down and retested that line for support then lifted strongly into the bell.  With the afternoon lift up from the 5 EMA line this completes all the steps for the beginning of a multi-month rally in the stock market.  

Also in the lower chart above the bond traders finally gave in on that light gray floor line I have drawn in and the TLT is now down to its 50 EMA line.  On Monday if the TLT slips through its pink 50 EMA line, that will mark the end of the 3-month bond position trade and seriouos bond money will begin migrating to the stock market to increase volume on a potential 2-3 month rally upwards in the stock market.


click on above image to enlarge


In the lower chart above, the TLT has finally dropped out of its core 12-week blue line channel.  Also marking the imminent end of the bond trade.


click on image to enlarge


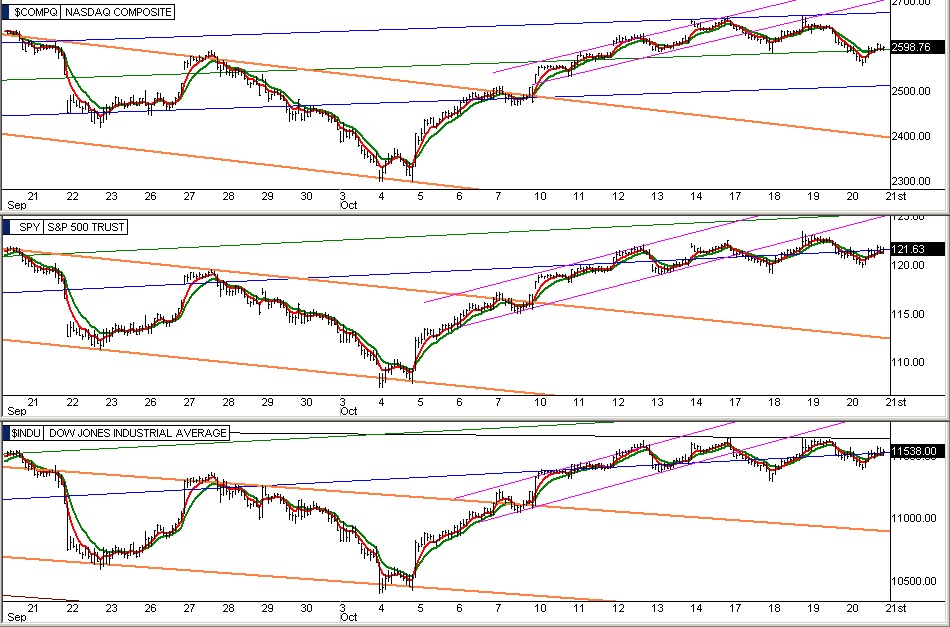
In the above charts we see that both the SPY & the DOW have now regained their core blue line channels. 


click on above image to enlarge


In the above chart set, the UUP, TLT, and VIX have lost their weeklong uphill brown line channels today which were a very persistent effort to keep the indexes from breaking down but now it is happening.


click on above image to enlarge


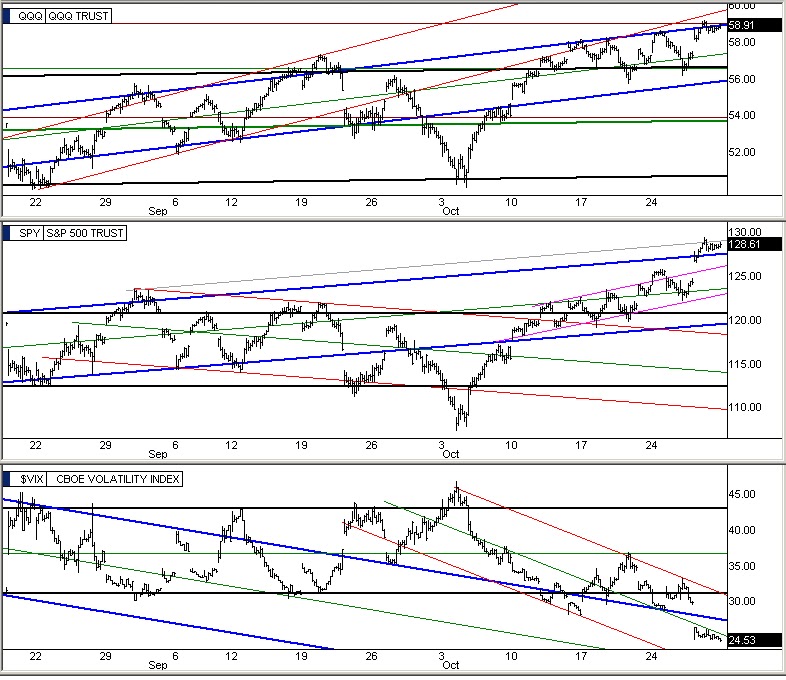
In the above chart set the QQQ and the SPY both bounced up from the center of their blue line channels in the afternoon today, a sign of increasing bullishness.  The VIX is now back down to the lower line of its 3-month horizontal black line channel where if it closes below that line on Monday, then opens and falls lower on Tuesday morning, more and more market technicians will be getting on board to the idea that we will have a fall rally afterall and it is beginning now.


click on above image to enlarge


In the above chart set there are three positive things that happened today, the Advance Decline broke above its 3-month downhill blue channel and also, its 3-week downhill brown channel and regained its 3-week uphill green channel.  While we are obviously high at today's close on the Advance Decline and its due for a numerical pullback on Monday, it's easy to see we are working ourselves out of the suppressing 3-month heavy blue line channel. 


click on above image to enlarge


The above chart set is once again the most imporatant as we see that with today's trading bar the NASDAQ, S&P 500, and the DOW have all three regained their red line channels and the NASDAQ has also regained its May thru July horizontal black line channel.  All three now have their blue channel as their dominant channel and barring any surprise blow up situation in Europe, we can see that as each of these indexes climb to their upper blue channel lines they will also be well up into their horizontal black line channels which should be a return to market stability.  On the right side, the TLT dropped below its pink line channel today and is clearly now in a major downtrending channel.  The UUP also slipped thru the lower line of its horizontal pink line channel today and is now being driven down in a very steep brown line downhill channel.  In the VIX we see that yesterday's reversal the center line of its 3-month horizontal channel did indeed cause it to break down today as it begins establishing a downhill brown line channel also. 


Click on above images to enlarge


In the above set the moving average retest bounce on the quarterly and monthly bar charts of the indexes that I brought attention to on 10/10's second evening blog, now have their red 5 EMA lines showing that the lift is starting to happen.  In chart six, the DOW's red 5 EMA has already turned upward, the S&P's has leveled out and today's closing price has now barely reached the top side of the red 5 EMA line which will cause it to start turning up with upside market movement next week.  The NASDAQ closed today well above its 5 EMA line and because it's a more volatile index it often does pinpoint bounces that climb really fast as can be seen in last summer's pinpoint bounce.  It's not hard to see that after last summer's line retest in the monthly bar charts 4, 5, and 6 that this setup produced an 8-month market rally which is virtually identical in the setups being worked here once again.  Thus, a three month rally is a reasonable expectation.  Next week is the key week, if we close Friday considerably higher than we are now then they have pulled it off and we should be going much higher over the next few months.

Alan
Please see risk disclaimer below


Thursday, October 20, 2011

End of Day Trendline Charts Update 10/20/11

Stock Market Technical Analysis Blog


click on above images to enlarge


Another choppy day in the market with one modestly bullish aspect being that the SPY tested and bounced up from its 50 Day EMA for the second time this week.  The market is still struggling to keep moving up escpecially the S&P 500 and the DOW as can be seen in chart set seven where they are still clinging to the lower line of their uphill channels.  The TLT bond ETF has been consolidating sideways for a week now.  The NASDAQ has some fairly serious selling today but did bounce in the afternoon from its lower blue channel line which can be seen in chart seven also.  The S&P and DOW are being worked down into a corner at the intersection of their downhill red channels and uphill blue channels which will force them to pick a direction within a couple of days anyway.  The bond and dollar bulls still refuse to sell any farther down on their charts as they as well as other traders can see how intensely the stock market is being propped up intraday.  The VIX chart in set seven shows it reached resistance at the center line of its horizontal channel today which could help the market tomorrow.  With the S&P, DOW, TLT, and UUP basically consolidating sideways for a week now it's likely to be up to the NASDAQ to determine overall market direction.  It has dropped considerably since yesterday's high but maybe it can bounce from its lower blue channel line that it tested intraday today and pop back up into its midyear black line horizontal channel and also its July red channel which if it could would break the DOW and S&P out of their consolidation mode and up into their respective red line channels, all can be seen in chart set seven.   We will have to see.

Alan

Please see risk disclaimer below

Wednesday, October 19, 2011

Prop and Drop 10/19/11

Stock Market Technical Analysis Blog


click on above images to enlarge

Through the first half of the day today trading was light and very few positions were taken in either direction as the indexes were being intensely propped up until midafternoon when an ominous price pattern came down to a point and the market dropped like a rock down to its lower line of its weeklong uphill channel.  The market stabilized there and went sideways into the closing.  The notable item is chart set seven where we can see that the past few days trading has been a sideways rangebound process across almost all of the indexes still leaving any market direction to be resolved.

Alan

Please see risk disclaimer below

Blog Archive