Stock Market Technical Analysis Blog


click on image to enlarge
Sasquatch, the monstrous short interest, was out feeding early this morning and took a healthy bite out of the bulls. Not a major wound yet as the bulls are still standing. Considering the fact that Ben & Co are within 90 days of flying the coop and they will likely have to walk off with the QE waterhose laying on the ground running full force, I am expecting lots of market propping every chance they get. Ben will likely want the market to be at an all time high as he exits but between now and then it could be choppy and all over the place.
Taking a look at the charts:
- Chart 1: No clear short term direction yet but today's low did find at least temporary support at the orange EMA line
- Chart 2: 60 min bar chart of the SPY showing the short term ascension channel that we fell out of today but not that far as there was plenty of propping in the afternoon
- Chart 3: Weekly candles - is showing a topping shooting star at midweek but we have to see how it closes Friday night
- Chart 4: Daily candles - we have a hammer reversal candle today - caution - no guarantees as there is contradition between the weekly and daily candle and there hasn't been enough down trading days in front of today's hammer to give it much strength for reversal
- Chart 5: 60 min bar chart of the VIX showing its short term descending channel, note it continued its uptrend for the third day
- Chart 6: shows the SPY dropped back down below its upper channel line
- Chart 7: shows the VIX is building a base at its lower channel line
- Chart 8: shows the SPY is extended away from its 100 day EMA line, about as far as it ever gets away from it and also shows the steadily decreasing volume as the rally went higher
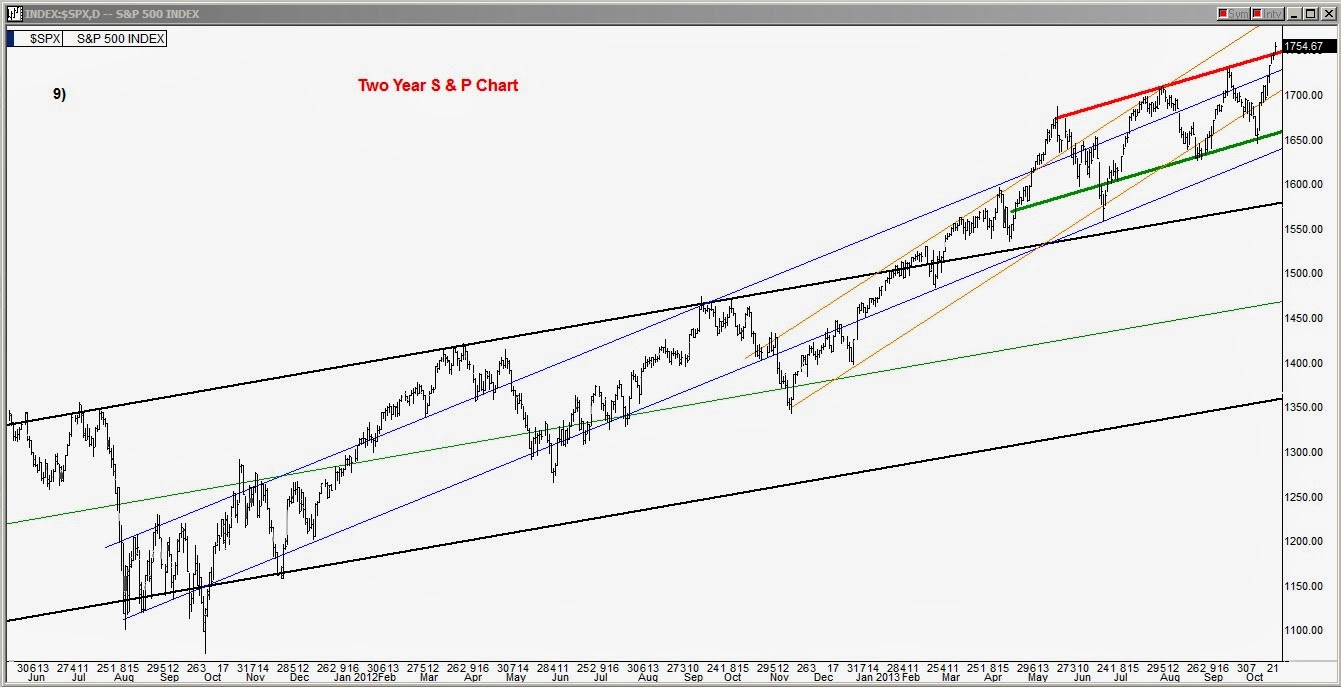
- Chart 9: the two year chart of the S&P showing how it has bubbled out of its primary black line channel
- Chart 10: the 25 year chart of the S&P showing we still have another 2-4 months in the current 5 year supercycle
Trade well my friends
Alan