

Click on above images to enlarge
Today started out looking like just what we needed. The markets climbed quickly and steadily. In row 2 of the lower chart cluster we can see that at about 1:00 today the S&P ran right up to the bottom side of the red channel. Instead of crossing up into it, the S&P was turned back down by it. This happened at the same time the advance/decline in row 3 touched up against the big sell line. They had it going and then they lost it at the first real resistance. Now they are in the situation where they have used up the ammo of the advance/decline going from oversold up to overbought without getting us back up into the red channel. Now it is time for the down oscillation in the market to take the advance/decline back down to the green area. This will take considerable intervention again tomorrrow to counteract today's failed channel recovery attempt.
In chart 1 of row 1, we see that the red 5 did lay down on the pink 50 today, but now must turn up tomorrow despite the overbought advance/decline situation. This will be difficult. The only way I can see for them to pull it off would be to bleed off all the stocks except for the big caps, but hold the big caps firm. If they only let the rest of the stocks go down modestly and then reverse them at the center black line of the advdec chart before too much downdraft happens, then push all stocks up at the same time, then they may succeed in making another attempt to get back up in the red channel of row 2.
Also in chart 1 row 1, today's volume was higher than yesterday's volume which is a positive. In chart 2 row 1, we see a somewhat bearish candle but it did cross above the 324, the long term neutrality line which together are a bit of a mixed bag. In chart 3 row 1, we see that we didn't quite make it back up to the 108 MA red line.
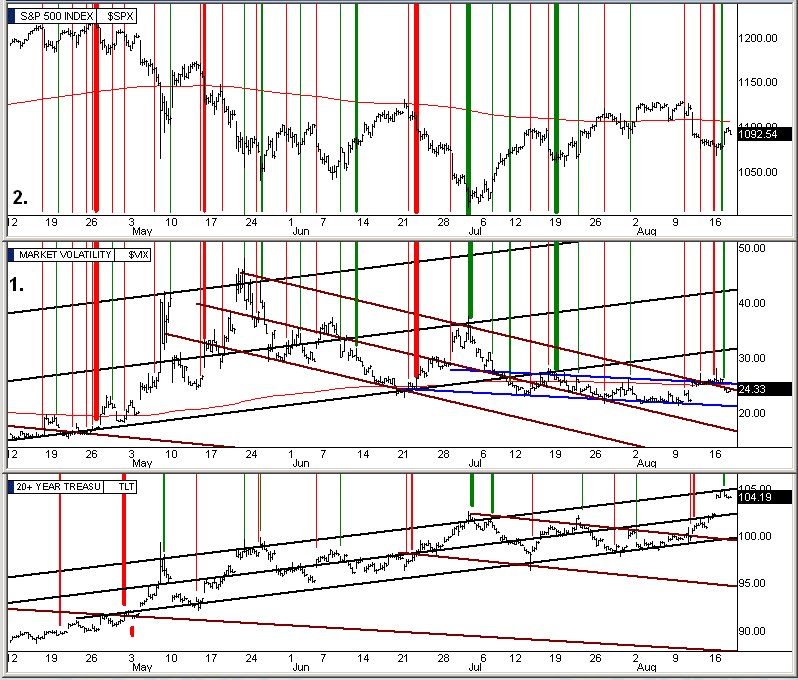
Looking up at the upper chart cluster, the top two are the S&P and VIX we have been following for a few days and you will notice that this morning's market move up turned the vix/fear back down into the brown downhill channel thus earning the medium green line vix buy signal which has been drawn. As you look to the last 2 hour bar on the vix chart though you see that in the late afternoon the vix turned back up and is threatening to jump back out of it. Can you say bipolar? The vix closed exactly on the brown line.
You will notice in the top chart cluster that I've added a third chart - the TLT, the ETF trading vehicle for the 20yr treasury bond which marks its moves precisely. Yesterday there was a big gap up in the bond prices and there was widespread sentiment that it was going to breakout of the channel to the upside because of the inflow of stock market money moving to bonds for safety. Yet, it did not happen, you can see the TLT could not break out and was turned down at the upper black channel line. This I marked with the medium green buy signal. This is a huge plus for the efforts to push the market higher. Huge hedgefunds that simply rotate back and forth from the bond market to the stock market, because they trade almost perfectly inversely, will now be rotating back into the stock market for a little while. Most bond traders though will be looking for the confirmation of the TLT price coming up and touching the upper channel line again and pushing down from it a second time. If that happens we will have a huge flood of bond market money slush back over to the stock market for a few days.
The big wall street firms that desperately need the market higher by Friday because of the Put inbalance I discussed last night will be waiting with open arms for the short term bond money to rotate back over to stocks. Until of course the TLT gets back down to its lower black channel line again and then they will pull all the money back over to the bond market once again.
To summarize the 20 yr treasury and the Vix trade almost perfectly inversely to the S&P but are typically 2-4 hours ahead of the S&P so that those that study their charts closely can get a jump on their S&P trade decisions. More importantly the vix and 20yr treasury only maintain a couple of channels at a time and breakouts & reversals of their channels sometimes are 2-3 days ahead of the opposite move happening in the S&P and the broad market. If you plot all the channels on the S&P 500 in a 6 month chart right now there are actually 16 channels of all various sizes being used. They do this to keep people confused but if you follow the vix and 20 yr treasury, their channels are very few, clear, and simple and will really give you a lead on what's coming in the broad market.
Since today's channel recovery attempt failed we are still in limbo once again tonight. Everyone will watch each 2 hour bar of the 20yr treasury and vix tomorrow.
Alan
P.S. Two more of the untriggered buy orders have triggered and moved to open orders
P.S. Two more of the untriggered buy orders have triggered and moved to open orders