Stock Market Viewpoint

Stock Market Viewpoint
Reading the Tea Leaves...

Tuesday, September 28, 2010

Stock Market Technical Analysis Blog

Before I post tonight's usual charts and analysis I would like to post a really good article about one of the more stealthy methods the FED has been using to pump the markets up artificially this year:
-------------------------------------------------------------------------------------------------------

"The Only Reason Stocks Have Rallied This Month"    by Graham Summers

The Fed generally claims that it stopped its first Quantitative Easing (QE) program back in March 2010 and that there were no additional debt monetizations between then and the announcement of its QE lite program in August.

Yet, as I’ve proven time and again, the Fed has continued to monetize Wall Street’s debts EVERY options expiration week since QE 1 ended… proving beyond a doubt that the Fed’s QE program did NOT actually end in March.

Here’s the chart of the Fed’s recent actions for those of you who haven’t seen this before. Options expiration weeks are in bold.

Week
Fed Action

July 22 -$8 billion

July 15 +$8.6 billion

July 8 2010 +$1 billion

July 1 2010 -$13 billion

June 24 2010 +$175 million

June 17 2010 +$12 billion

June 10 2010 -$4 billion

June 3 2010 +$2 billion

May 27 2010 -$16 billion

May 20 2010 +$14 billion

May 13 2010 +$10 billion

May 6 2010 -$4 billion

April 29 2010 -$1 billion

April 15 2010 +$31 billion

April 8 2010 +$420 million

April 1 2010 -$6 billion

You’ll note that the Fed ALWAYS made its largest capital contributions during options expiration weeks. Heck it pumped $31 BILLION into the system in April 2010, just ONE MONTH after it claimed QE 1 ended!

However, since that time the Fed has pumped a total of over $65 billion into Wall Street on options expiration weeks. On non-expiration weeks the Fed either withdraws money or makes small money pumps.

This pattern finally ended in August 2010 when the Fed failed to pump the system on options expiration week. But then again, why bother? The Fed was about to announce its QE lite program in which it would use the interest on maturing securities to purchase Treasuries from Wall Street Primary Dealers via its Permanent Open Market Operations (POMO).

I realize that last sentence is a lot to take in. So let me explain how this new QE Lite Program works before we continue.

During Treasury auctions there are 18 banks, called Primary Dealers, who are given unprecedented access to US Debt (Treasuries) in terms of pricing and control. These are the BIG BOYS of finance including firms like Goldman Sachs (GS), JP Morgan (JPM), Bank of America (BAC), Credit Suisse (CS), and others.

During its QE 1 Program, the Fed bought over $1.0 trillion in securities from these firms. Its new QE lite program consists of it using the interest and proceeds from the securities in its portfolio that are maturing to buy Treasuries from the Primary Dealers via Permanent Open Market Operations (POMO).

In simple terms, the POMO actions allow the Fed to pump money into Wall Street (by buying Treasuries from the Primary Dealers) without DIRECTLY monetizing Treasury debt (the Treasuries had already been issued). The Primary Dealers then take this fresh capital from the Fed and plow into stocks, forcing the sort of ramp job we saw last week on Friday.

All told, the Fed has bought $20 billion worth of Treasuries in this fashion, $11.15 of which it purchased last week alone. With this kind of weekly money pumping in place, Bernanke and pals don’t need to continue their “behind the scenes” games (like the options expiration week money pumps).

Or do they?

Unbeknownst to most investors, last week Ben Bernanke pumped an additional $11.05 BILLION into the system ON TOP of the $11.15 pumped via the POMOs. In plain terms, the Fed juiced the system by $20+ billion in a single week, bringing its liquidity pumps RIGHT BACK QE 1 LEVELS.

If you want to know why stocks have rallied in the last month, this is THE reason. The economy isn’t improving and the European Crisis isn’t over. Nothing has improved. All that has happened is the Fed funneled money into the Primary Dealers who ramped the market.

This is also the reason why the latest rally has almost entirely consisted of gap ups: the Primary Dealers ramp the market and then the computer trading programs take care of the rest.

In plain terms, the market is being juiced higher, plain and simple. There is no fundamental reason for stocks to be rallying. Moreover, we have numerous signs of a top forming (mutual fund cash levels, insider selling to buying ratios, negative divergence, etc). Those who choose to buy into the farce of a rally are going to get what’s coming to them. And when they do, it won’t be pretty.

(end of article,  my post for tonight follows below)
-----------------------------------------------------------------------------------------------------
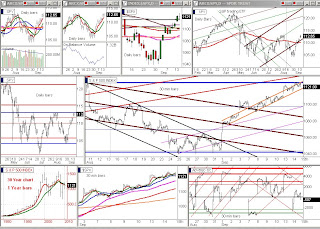
Tensions rising ...


Click on above images to enlarge

Today the stock market received a second prop visible in the lower chart cluster, row 1 chart 4.  We now have two props holding us up from the lower line of the brown mother channel.  The reason for these props is visible in the chart directly below that one ( row 2 chart 3 ) , where we see that the S&P has now tried and failed four times to get back up into the red line bull channel from early summer.  This struggle is causing the VIX/fear index to build a setup for moving higher.  To help follow the key relationship between the VIX and the S&P I am adding a second pair of charts into the lower cluster, row 2 position 1. These are daily bar charts with 5/10 moving averages to give us a different perspective on the inverse relationship  between the S&P and the VIX.  (we have been following the VIX and S&P on 2 hour bar charts with channels drawn in the upper chart cluster,row 1 and row 2. )  These 2 new charts are of the VIX and are stacked on top of each other directly below the S&P chart which is it's market inverse.  What we see happen in the S&P chart (with green side bar print) should be the mirror opposite of what happens in the 2 VIX charts below it which have their side bar print in red.

Which leads me to tonights big issue -  the S&P put/call for today is a incredibly bearish 3.53 which means the vast majority of options players see that the past 3 days market action has been grossly manipulated upward and may be about to fall back in everyone's face.  This manipulation can actually be seen in the lower chart cluster, row 1 chart 1 (S&P) when compared to row 2 chart 1( the 5/10 ma chart of the VIX ).  If you study the red 5ma line and the green 10 ma line in one and then the another you will see that in the VIX the red 5 crossed above the green 10 line last week and the S&P should have done exactly the opposite - its red 5 line should have crossed down through it's green 10 line to match perfectly but inversely. But Friday the bailout team intervened big time and the S&P 5 line bounced up from its 10 line instead instead of piercing down thru the green 10 to match inversely with the Vix.  A classic bearish divergence.  Now, as the VIX 5 line has been starting to be pushed upward by its 10 line,  the S&P is supposed to have its 5 line up underneath its 10 line and it should have started to push downward by its 10 line over the past couple days - like the VIX but upside down. As you can see though their market jamfest last Friday altered these lines so that the S&P 5 line is still above its green 10 line.  

This divergence is revealing that the past 3 days is not real trading and artificial moves typically reverse in an ugly fashion.  The S&P put/call shooting up to a nightmarish 3.54 is reflecting the widespread anticipation that this forced market action is about to fail. 

The Vix is a complicated tracking device for measuring fear in the market.  This is an indicator that does not lie and cannot be manipulated by design.  When the S&P is not the mirror inverse of the VIX, the S&P is being manipulated to keep the market from pulling back when it really should be and seasoned traders and investors know to keep their hand close to the sell button.  It is going to be interesting

Alan

Sunday, September 26, 2010

That will work...

Stock Market Technical Analysis


Click on above images to enlarge

Thursday night's make or break situation in the market rocketed to the upside at the open Friday.  All four items I discussed Thursday night successfully resolved to the upside Friday:

- In the upper chart cluster, row 1, the S&P did the price retest up from the upper blue channel line. 

- In the lower chart cluster, row 1 chart 1, the red 5 MA line turned up quickly from brushing against the 10 MA line instead of piercing down thru it.

- In chart 3 row 1, the S&P successfully retested the gray 150 and black 200 MA lines.

- In chart 4 row 1, we successfully retested and bounced up from the lower brown line of the mother channel.

The only item that might give one pause is row 2 chart 3, showing the 30min bars of the S&P and how with Friday's blast upward was stopped at exactly the lower red line of the steep bull channel from early summer.  This is also what stopped us back on the Sept.20th & 21st.  Once the S&P is back in the red line channel, the bulls will have good control of the market but the bears will be looking at the lower line of the that red channel as a place where they will take their last stand to stop this rally. 

In row 3 chart 3, the adv/dec is extremely overbought Friday afternoon and needs at least some sort of a pullback on Monday before it can go higher. 

Alan

Thursday, September 23, 2010

Make or break retest is here...

Stock Market Technical Analysis


Click on above images to enlarge
After a couple days of pullback the S&P has come back down to retest the upper band of this summer's  horizontal trading range after breaking up through it 2 days ago. This can be seen in the upper chart cluster, Row 1.  If the upper blue line holds as support now we have a bonafide breakout.  If it falls back down into the blue channel, S&P 1040 will become a magnet pulling us back down to it.  In row 2 of the upper cluster, we see that if the S&P breakout line holds then the VIX will get turned back down when it is near its upper  blue channel line, which would allow the bulls to take control next week.  If the S&P slips through the blue S&P upper band this will cause the VIX to break out of its blue channel which would earn the #3 Sell signal on the stock market. 

In the lower chart cluster, row 1 chart 1, we see that tomorrow is also make or break day for the 5/10 moving averages, either the market sells and the red 5 will pierce down thru the 10 MA line marking an official end to the rally or if the market rallies tomorrow the red 5 will begin bouncing up from the green 10 MA line to begin another wave up in the market. 
In chart 3 of row 1 we have another make or break in that we will be retesting the black 200 ma  and the grey 150 ma lines tomorrow.
In chart 4 row 1 we have yet another make or break tomorrow in that we will also be retesting the lower brown line of the mother channel.
In row 2 chart 3 We see that this morning's open and today's close are a nice double pin set up starting.  In row 3 chart 2, the intraday chart, we see that they are setting up a nice 5/108 ema bounce set up.  In row 3 chart 3 we see that today's double pin bottoms are both down fairly deep into the buy area of the advance/decline chart, a big plus.

Tomorrow is Friday and over the summer the prevailing pattern has been for Fridays to be the slow float upward on low volume day, followed by a gap up at Monday's open.  This makes really convenient timing for the bulls and the bailout team. The problem is the bears know this also and they will be ready to short big at the first sign of weakness.  Three weeks of driving the market up means nothing without a successful retest of the breakout line.  Don't bet more than you can afford to lose either way on this one.

Alan

Tuesday, September 21, 2010

A bit of a concern here...

Stock market technical Analysis

Click on above images to enlarge

On the first day after a historical breakout in the market, the vix and 20yr bond are both projecting concerns here.  In the upper chart cluster, row 3, the 20yr  bond climbed back into its black mother channel significantly today earning a #2 sell signal on the stock market.  In row 2, the vix now has a triple bottom in place at the 21.00 level and poised to start upward earning a #1 sell signal on the market. 

In the lower cluster, row 1 chart 1, today's pullback volume was considerable stronger than yesterday's breakout volume, a very bearish situation.  In row 2 chart 3, the S&P tried twice to  get back into the red steep bull channel from late spring / early summer and fell back out both times. 

The most overriding concern today is the big volume on this pullback day and having only modest volume on yesterday's big technical breakout day.  This implies there was major selling today and or new short positions in the market.  The two volume bars should be reversed, big volume on the breakout day and small volume on the pullback day.  This bearish volume situation is very likely what is causing some of the short term bond money players to move back over to bonds.  The vix not dropping down below the 21 level (lower blue line of current channel) is very bearish also.  Yesterday the S&P broke out of a 4 month sideways channel to the upside.  The vix should have broken out of its channel to the downside an equal amount but it didn't happen, instead we put in the third bottom of a triple bottom at the 21 level which could easily be a springboard for a big jump in volatility here.  This is somewhat disappointing in that a couple of weeks ago, the bailout team seemed to be getting serious about getting the market up but if they think an occasional short squeeze by itself is going to do the job, I have real concerns that they don't truely understand that this is a heavy market that will drop if they don't consistently keep pushing it and follow through consistently so that the masses of disgruntled investors will start to trust it and come back into the market. 

By the way, today's S&P put /call ratio is 3.67, extremely bearish.

Alan

Monday, September 20, 2010

Resistance breaks, the squeeze is on...

Stock Market Technical Analysis

Click on above images to enlarge

Finally, the upper band of this summer's trading range gave way today and the big standoff between the shorts and the longs is resolved with the shorts scrambling to cover their short positions once again. 

In the upper chart cluster row 1, the S&P breaking out of its blue channel earned the #3 buy signal line.  In the lower chart cluster, row 1 chart 1, today's volume just barely reached its average level which is really disappointing considering how big this breakout is and that a good amount of volume was added by the shorts covering.  In row 2 chart 3, we see that in the last 30min the S&P barely got up into the steeply inclined red channel from earlier this summer.  Row 3 chart 3, we see that the advance/decline is in the sell area now but that doesn't necessarily mean we will have much of a pullback. 

Technically today's breakout is the beginning of the execution of an inversed head and shoulders pattern as can be seen in the lower cluster, row 1 chart 4.  The first shoulder is the wave down from 5/20 to 6/18, the head goes from 6/21 to 8/9, and the right shoulder from 8/10 to this past Friday.  The vertical measure of this inversed head and shoulders pattern goes from S&P 1015 to S&P 1125.  This is a 110 point measure, if you add 110 points to the 1125 breakout level you come up with S&P 1235 as a potential target.  Under normal circumstances this would be a really nice secure position trade for the fall but be aware that the rally off of the 1040 floor of the summer range and today's breakout from the upper band are meticulously crafted and brutally forced rallies with heavy political underpinnings behind it.  Even though this inversed head & shoulders measures for a good run up thru the fall, the reality is it will only go as far as the powers that be continue to sponsor it.  Granted I am expecting them to really push this thing to help undo the bad sentiment against Wall Street and Congressional imcumbents.  This rally could end tomorrow or go another 3 months. In the current market, the path of least resistance is down but the short squeeze is a powerful force and that is what they are using to make the market go higher.

Over the past few months it has been shown that 60% of the avg daily volume on the exchanges is ultra high speed automated trading where computers make literally thousands of trades every second.  The abnormally low volume that we see on the chart indicator would be much less if you took out the 60% attributed to the new phenomenon of ultra high speed flash trading by computers.  If you took out the volume attributed to the shorts being forced to buy to cover their short positions, there is just not a whole lot of regular investor volume to be counted.  The average investor is a small participant in these rallies.

Alan

Thursday, September 16, 2010

Waiting to see who blinks first...

Stock Market Technical Analysis

Click on above images to enlarge

In today's market we had our 4th day of sideways trading on the S&P that amounted to very little change in the overall situation since my blog post last night.  The most important thing to mention is a divergence that is occurring between the adv/dec and the 30min bars of the S&P chart.  Looking at the lower chart cluster, row 2 chart 3, we see that since Sept 2, the S&P has been climbing steeply then leveling off sideways for the past 4 days but when you look at the adv/dec chart directly below it (row 3 chart 3) we see that the adv/dec ratio on the vast expanse of stocks has been basically in a downhill channel since 9/2.  This is a fairly strong divergence and might very well be causing the sideways holding pattern we've been in the past four days.  The mega caps have been exhausted by being driven up relentlessly while the vast expanse of the other stocks have been having more and more of their numbers starting to sell off during the same period producing the downhill channel in the adv/dec chart.  Since the S&P 30min chart shows that it's not going to be able to break out of the upper blue channel line with a bunch of exhausted megacaps on their own, it looks as though we are having to wait for the adv/dec ratio on the full breadth of stocks to get deep down into the green buy area where big opening gaps spring up from, especially when we can't move higher any other way.  While the adv/dec just barely touched down into the first sell area line, most traders would feel that it would need to go deeper to get more springboard power under the vast expanse of stocks so that they can help push the S&P and megacaps above the blue upper channel line.  Conventional wisdom says that the adv/dec needs to go down closer to the -3500 to -4000 area to get some true lift power but if the shorters are thinking the same and not taking any of their short positions off until we do get farther down in the adv/dec, the bailout team might decide to get ahead of the pivot point again and try to bounce the market up tomorrow when the shorters are not covering their positions yet figuring that they don't have to until the adv/dec get does get into that -3500 to -4000  area.  This would be another short squeeze opportunity for the bailout team if they think they have the ability to break us out and follow through. 

Another notable item:  S&P Put/Call ratio dropped down to .54 which means that the great majority of traders and investors believe that we are getting ready to break out of the blue line channel to the up side and are positioning themselves for that.  This is a very bullish number.  There is one wild card tomorrow in that it is quadruple witching expiration day.  Contracts for stock index  futures, stock index options, stock options and single stock futures (SSF) all expire.  This often produces strange and illogical movement in the indexes.

Alan

Wednesday, September 15, 2010

Bulls & Bears both take pause...

Stock Market Technical Analysis
Click on above images to englarge


Today's market activity can be best described as both the bulls and bears stepping back, neither side sure of what tomorrow will bring.  The underlying bias is definitely toward the possibility that the powers that be are going to force an upside breakout of the summer's horizontal trading range shown in the upper chart cluster, row 1.  The put /call ratio on the S&P 500 index dropped all the way down to .77, a quick shift to bullishness during the mid day today.  No doubt giving worry to the new shorts that were obviously a big part of yesterday's strong volume.  

In the upper chart cluster, row 3, the 20yr bond sold off strongly right from the open indicating some of the short term bond money players are having second thoughts and some are moving back over to the stock market in case a breakout to the upside may be coming.  This earns the smallest buy signal on the stock market, noted with the #1 green line.  Row 2, the vix/fear index rolled over and turned back down into the bell also earning the #1 green line buy signal on the stock market.  In the top row, the S&P made its third attempt to break above the upper blue line of the summer's channel but stopped right at it. 

In the lower chart cluster, row 1 chart 1, today's volume was substantially less than yesterday's which implies indecision in the masses considering where we are at.  Chart 2 row 1, the price bars are still riding on the red 5 EMA line and today's move was a push up from being exactly on the red 5 line which typically means 1-3 days of up movement  from the price/5 EMA bounce.  Chart 3 row 1, today's candle is a modestly bullish one with this morning's low receiving support from the black 200 MA line.  Chart 4 row 1, even though the brown mother channel is steeply inclined, we are still pretty much maintaining our distance above its lower line that we crossed last week.

Row 2 of the lower cluster, I added an additional chart at the number 1 position.  This is a three year chart of the SPY showing monthly bars and it has the monthly 108 EMA in it to show how the upper line of this summer's trading band also coincides with the 108 EMA on the monthly bars chart which makes it a larger pivot point and no doubt, a very volatile area.  Chart 2 row 2, shows the upper blue line band is still containing the past four months of trading.  Chart 3 row 2, the S&P is still maintaining its bottle rocket trajectory with the super narrow, vertical ascension channel shown in gold.  You can also see it took three tries at that blue line in the past two days if you look closely.  Row 3, the 30yr chart /yearly bars, this 2 week rally has pulled the tip of the red 5 EMA line up really tight against the underside of the green 10 MA line.  In the big picture, this is a very critical point, either the 5MA punches up through the green 10MA to begin a possible multi year run up in the stock market or the 5MA line gets pushed back down by the 10MA which would be a nightmare scenario that the S&P has not been exposed to before.  Chart 2 row 3, the intraday 30 min bars chart, the red/green/blue (5/10/21 MAs) active MA lines compressed together in the early afternoon trading implying the path of least resistance (at least  tomorrow morning) is to the upside.  Chart 3 row 3, advance/decline action is not so bullish.  Yesterday and today's green line buy area bounce both failed shortly after crossing the neutral center black line.  This implies that the collective mass of all stocks is not participating as well as the mega caps which is what is being used to drive this market spike.  We really need to see all the rest of the stocks participating more in line with the mega caps to give credibility to this short squeeze that they keep driving up.

Alan

Tuesday, September 14, 2010

Here come the shorts...

Click on above images to enlarge


Today we finally reached the fourth hurdle that I spoke of last night, tested it twice and then the market turned back down into the bell.  This could get real serious really fast if it turns out the biggest short squeeze we've seen in years was nothing more than a move across the channel from the lower line to the upper line of the summer's blue line trading channel. 

In the upper chart cluster, row 3, we see the bonds are continuing to rise as short term bond money has been returning to the bond market after a week and a half in the stock market.  In row 2, the vix index has bounced back up from the lower line of its blue channel for the third time in the past 2 days which earns a #2 sell signal on the stock market.  In row 1, I drew in the blue summer trading range channel to help make it a little more visible & it shows yesterday's #1 bond sell signal and today's #2 vix sell signal on it. 

In the lower chart cluster, row 1 chart 1, we see strong volume today when normally you will have really weak volume when we come up against such a major barrier as the upper band of the summer trading range.  The extra volume is from shorts piling on, expecting this to just be a channel move instead of the beginning to a big end-of-year multi-month move up in the market.   When shorts come in big within a couple of days, it creates a volatile situation.  If the bailout team does not intervene to stop the impending drop, the market will sell hard and all professional traders know it which will draw more short selling.  If there is an intervention to pop us out of this 4-month sideways channel in the next couple of days, there will be a new and equally fierce short squeeze on these new shorts that will make the market rocket up. 

In row 1 chart 3 of lower cluster, today's candle is a reversal candle which short sellers will like considering where we are at.  Row 2 chart 1, you can clearly see the upper blue band of this summer's trading range and how we are stopping at it.  In row 2 chart 2, this morning and afternoon's attempts to break above the blue line both failed.  In row 3 chart 3, this morning's move up from the lower green buy area failed during mid-day and turned back down, no doubt from the massive short selling volume piling in fast. 

Will intervention happen tomorrow and will it break us out of this sideways channel or will the S&P ramp down to the 1040 lower line again?  No one knows but there sure are a lot of bets being placed today.

Alan

Monday, September 13, 2010

One last hurdle


Click on above images to enlarge


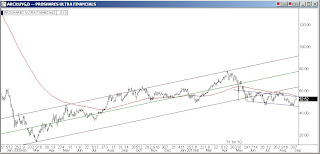
As of today we have three of the four things we have needed to clear the way for an end of year bull run.  In the center chart cluster, row 1 chart 4, we have regained the uphill brown mother channel after hopping across the 108 EMA line.   Second, today we broke out of the congestion MA lines which are shown in the center cluster row 1 chart 3.  Third, the financials finally broke out of their summer downtrend channel as shown on the bottom chart.  The last thing needed is to break out of the horizontal summer trading range that goes from S&P 1040 to S&P 1125 as shown in the center cluster row 2 chart 2.  To make this horizontal blue line trading range we've been in more visible, I've added a less focused in chart in the middle cluster, row 2 chart 1, where you can clearly see the blue bands of this summer's trading range and how today's close got us up really close to it but we still must break out of the top of this sideways channel or all of the past 2 weeks means very little.

In the upper chart cluster, the 20 year bond reveresed today which is the smallest sell signal on the market.  This can be interpreted as the bond traders believing that the last obstacle to be cleared, the upper blue band of the trading range, will be what stops everything.  They may be right or they may be wrong, we will see, but one has to also remember that Bernanke is starting to buy treasuries again and this would sure be the right time so that a bond market sell off can be prevented if the stock market does completely break out.  One other thing, in the middle cluster row 1 chart 1, we see today's volume broke out of the 2 week declining volume downtrend.

The S&P closed at 1121 today and the final hurdle is at 1125.  Everyone will be watching to see what happens in the next couple of days.

Alan

Thursday, September 9, 2010

Let's hope we don't run out of steam here

click on above image to enlarge


Very little time tonight but the most important chart of either group is actually in the lower charts, row 1 chart 4.  The S&P price has basically been slowly inching along the lower line of the brown mother channel.  This has caused the red 108 EMA to turn slightly upward and coincide with the lower brown line.  We are straddling two fences, this is the unique pivot point I have mentioned the past week and a half.  Today we closed exactly on the brown line.

On the jobs front, it's kind of a mixed bag...the unemployment numbers show improvement but the real reason is because there are masses of people exhausting their benefits and are coming off the list and this is grossly distorting the numbers and will for the next 2-3 months. 

There's going to be a big move, one direction or the other, once that double pivot point resolves itself.

Alan

Tuesday, September 7, 2010

It's all about the financials...

click on images above to enlarge

Today the markets pulled back as the big short squeeze ended.  The reason behind the pullback lies in the chart of the financials.  I added an extra chart tonight, the UYG  Financials ETF.  It is the largest ETF that tracks the Mega Banks.  One constant through the decades has been that every rally in the stock market will end up failing if the big financials are not participating.  They are a necessary player in every major leg up. This chart of the big financials shows how they have been contained by the blue line downhill channel.  Until we break out of this channel and successfully retest push up from the top side of it,  all rallys will likely end when the financials reach the upper channel line.  This is the chart that must break out succesfully for us to begin a new leg up in the market.

Looking at the middle cluster of charts, we see that todays sharp trend reversal earned the #1 or smallest sell signal line.  
Looking at the lowest chart cluster we see, in row 1 chart 3 we see that the S&P hit doulble overhead resistance today when it came up against the brown 100 ma line and the purple 250 ma line.  In chart 4 of row one we see that we slipped back down out of the brown line mother channel and also fell back down below the 108 ema line.  This is the unique pivot point I mentioned a couple of nights ago.
In row 2 of the lower cluster we see that the S&P slipped back down into the 5 week downhill brown line channel.
In Row 3, chart 2 - the 30 min bar chart, we see that the red 5 line is going to meet the pink 50 line tomorrow, an intraday pivot.  In chart 3 of row 3 we see that the advance/decline is back down into the buy area somewhat.

Today's market action is quite reasonable after a 3 day vertical move.  Now the ground campaign must show us what it's got.  We will see...

Alan 

Monday, September 6, 2010

Shock & Awe short squeeze

click on above images to enlarge

Friday was day 3 of  a genuine shock and awe short squeeze and going into the bell it was still building steam even more.  I kept in touch online with a number of professional traders over the years and it looks like most were short big when this started and a couple still have not been able to get their shorts fully covered.  The market has just been gapping up thru thin air at a blistering pace but when the squeeze is over, as always, we will find out if the ground campaign can do its part or not.

In the upper chart cluster we see that the 20yr bond sold even lower Friday but closed pretty much sideways.  The vix / fear index fell hard Friday and actually has a small descending triangle representing Friday's four 2-hour trading bars.  If the vix reenters the brown downhill channel, the number 3 buy signal will be raised to #4 - the largest.  In the top row of the upper charts, the S&P's trading action on Friday built a small bullish ascending triangle. 

In the lower charts, row 1 chart 3, we have four more large moving averages left in the congestion cluster to get thru before it's truly a breakout.  In chart 4 row 1, Friday morning we gapped over the red 108 EMA and also gapped over the lower line of the brown uphill mother channel.  In row 2, tomorrow or Wednesday we will possibly find out if the 1123 S&P level is going to be the end of the squeeze because it is the top blue line of this summer's trading range or if we are to break out of the blue line trading range and regain the very bullish red uphill channel.  Row 3 chart 2, the squeeze is still skipping the red 5 along the red 10 keeping the momentum going against those trying to cover their short positions.  Chart 3 row 3, the adv/dec is starting to get overbought but could still have some more upside tomorrow before being extremely overbought short term.

Whether or not this is the beginning of a new leg up or just a fierce surprise short squeeze to reduce the massive built up short interest in the market is yet to be determined.  To the average person who simply owns stocks in their retirement accounts, this vertical 3-day move will no doubt boost everyone's sentiment in general, and with elections getting close this is what this spike is all about.

Alan

Thursday, September 2, 2010

Buckle up for Friday's big payroll numbers report

Click on above images to enlarge

In the morning we will get the payroll numbers report and we should find out if the two day party in stocks is a genuine beginning of a new leg up or simply an anticipatory jamming of the market higher so that if the payroll causes a big smack down we wind up back at the S&P 1040 line.  

In the upper chart cluster, both the vix and the bonds both retested against the channel line they dropped on through yesterday morning which earns the #3 buy signal line for both.  For the bonds to earn the largest #4 green buy line they would have to drop thru the bottom line of their black line mother channel.  For the vix to earn the #4 green buy line it would have to drop back down into its brown downhill channel.

In the lower chart cluster, row 1 chart 1, today's volume was almost nonexistent.  This is likely a combination of both investors afraid to put any more money in until after Friday's payroll numbers report and a lot of people know that this is a brutally forced up rally and don't think it's sustainable.  In chart 3 row 1, today's candle opened just above the pink 50 line and crossed above the 324 EMA line into the close.  Just above it we have the great 108 EMA red line which is also shown on chart 4 row1.  Either tomorrow or Monday, the S&P will make a big attempt to cross above that pivotal line in the sand (assuming the payroll doesn't smack the market down as it has recently).   If the market does continue up to attempt to cross the 108 EMA tomorrow afternoon or Monday, it also has to cross the lower line of the brown line mother channel at exactly the same point as shown in chart 4 row 1.  This will either be a double power accelerant or double power resistance.  On top of that, to make it even more of an ultra pivot point, in row2, you see that the 6 week downhill brown channel also passes thru right at that same junction.  This triple pivot rarely ever happens and today's volume reflects a lot of people realize that and hence many traders will just sit and watch.  Nobody knows what is going to happen here. 

In row 3 chart 2 of the lower charts, the 30min intraday chart ,we can see how hard they have been driving this multi day jamfest in that they are maintaining a 5/10 red/green line repeating bounce.  Chart 3 row 3, we still have some room to move higher on the advance / decline chart tomorrow.  You will notice how most of the economic reports have almost magically turned positive during this 2-day market rally.  You might consider it a reasonable possibility that tomorrow's payroll report may get a little of that good old  accounting massaging to be sure it's release doesn't spoil anything.  Tomorrow and Monday means so much as far as whether or not we have the traditional fall run up in the market without the traditional Sept market dive, or whether we must still go through that.

Alan

Wednesday, September 1, 2010

A shift to being proactive?

click on above images to enlarge

Today we saw the bailout team execute a wicked jamfest of all stocks well ahead of the pivot point that was coming late tomorrow afternoon.  In the recent past they have been waiting until the very minute the pivot point is here or sometimes letting the market lose the pivot before stepping in.  Almost to the point of being indifferent until they absolutely had to intervene.  This has allowed the bears to prepare for the pivot point fight and they have been winning almost all of these pivot points.  Today though, they caught the bears off guard as they were waiting for the pivot point to do battle and this surprise intervention well ahead of the pivot caused a fierce short squeeze on the bears.  This is the kind of initiative it will take to push the markets higher and it's refreshing to see they have finally figured it out.  Now the shorts' standard game plan of resting until the pivot then giving it all they have to drive the market down is no longer a viable approach.  This could be a game changer.  The bailout team has really been stuck in a rut with their last minute intervention approach, then only applying half the effort needed to get the job done and ending up in failure.  This change is very encouraging.

In the upper chart cluster, row 3, the bond drop off this morning earned the number 2 buy signal but you will notice that they did start climbing back up as we approached the bell, probably in disbelief of everything that happened today.  Row 2, we see that the vix dropped back down into the bullish blue channel which earned a #2 buy signal. 

In the lower chart cluster, row 1 chart 1, the volume did bypass its average volume blue line.  In chart 3 row 1, at today's close the S&P got right up to its 50 day MA but hasn't crossed yet.  In chart 4 row 1, we have the highly pivotal situation of the red 108 EMA line is going to coincide with the lower brown line of the mother channel tomorrow which amplifies the power of this additional, very unique pivot point.  In row 2, the thin red line at the bottom has been changed to a medium blue line because this is the 3rd time that level has been used for support this summer, thus creating the 3 level trading range of blue lines that can be seen now.  Also notice that today's jamfest did break us out of month long black line down hill channel which is what the bulls have been waiting for.  In row 3 chart 1, the 30 year chart, you can see today's 3% move up in the markets raised the tip of the red 5 MA line up to the underside of the green 10 MA line whereas the red line has been curved down for a couple of weeks now.  In chart 3 row 3, we are in overbought territory but in this strong of a rally mode they typically will only let it fall to the black center line and use that as the buy line for a week or so to really keep the market drive going.

Everything overall looks good except for the bond chart, row 3 of upper charts.  That chart is signalling that there is hesitation with the short term bond players shifting anymore money over to the stock market until they see follow-through.   Maybe they will see it tomorrow.

Alan

Blog Archive