

Click on above images to enlarge
Today we finally reached the fourth hurdle that I spoke of last night, tested it twice and then the market turned back down into the bell. This could get real serious really fast if it turns out the biggest short squeeze we've seen in years was nothing more than a move across the channel from the lower line to the upper line of the summer's blue line trading channel.
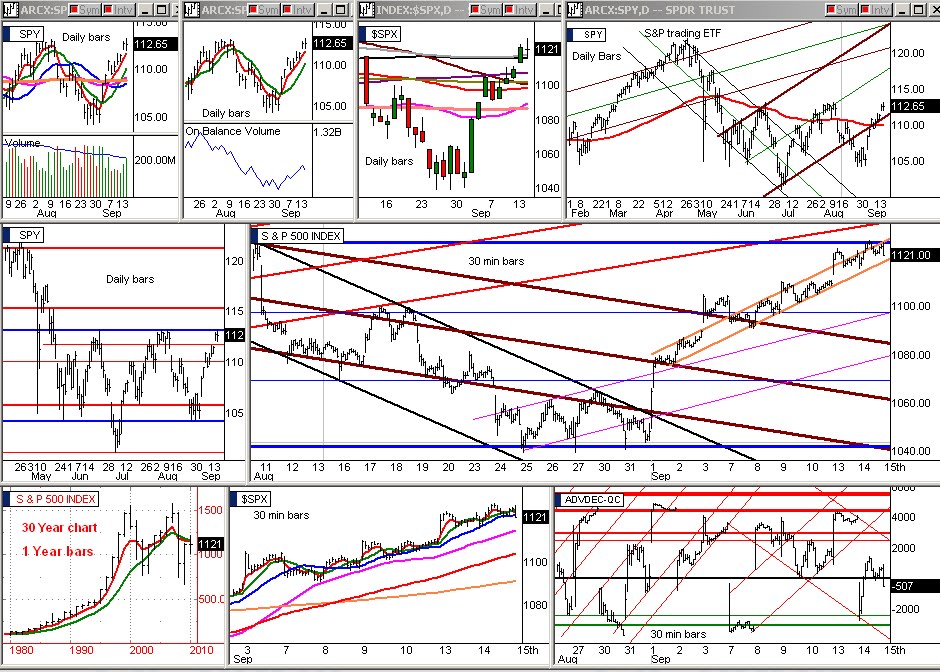
In the upper chart cluster, row 3, we see the bonds are continuing to rise as short term bond money has been returning to the bond market after a week and a half in the stock market. In row 2, the vix index has bounced back up from the lower line of its blue channel for the third time in the past 2 days which earns a #2 sell signal on the stock market. In row 1, I drew in the blue summer trading range channel to help make it a little more visible & it shows yesterday's #1 bond sell signal and today's #2 vix sell signal on it.
In the lower chart cluster, row 1 chart 1, we see strong volume today when normally you will have really weak volume when we come up against such a major barrier as the upper band of the summer trading range. The extra volume is from shorts piling on, expecting this to just be a channel move instead of the beginning to a big end-of-year multi-month move up in the market. When shorts come in big within a couple of days, it creates a volatile situation. If the bailout team does not intervene to stop the impending drop, the market will sell hard and all professional traders know it which will draw more short selling. If there is an intervention to pop us out of this 4-month sideways channel in the next couple of days, there will be a new and equally fierce short squeeze on these new shorts that will make the market rocket up.
In row 1 chart 3 of lower cluster, today's candle is a reversal candle which short sellers will like considering where we are at. Row 2 chart 1, you can clearly see the upper blue band of this summer's trading range and how we are stopping at it. In row 2 chart 2, this morning and afternoon's attempts to break above the blue line both failed. In row 3 chart 3, this morning's move up from the lower green buy area failed during mid-day and turned back down, no doubt from the massive short selling volume piling in fast.
Will intervention happen tomorrow and will it break us out of this sideways channel or will the S&P ramp down to the 1040 lower line again? No one knows but there sure are a lot of bets being placed today.
Alan