
Stock Market Technical Analysis Blog


click on above images to enlarge
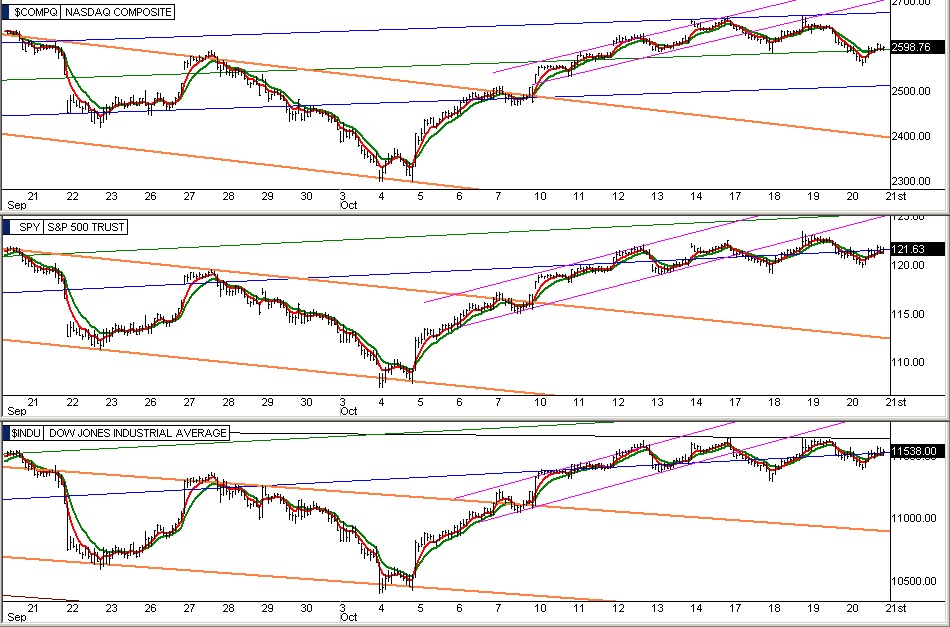
Another choppy day in the market with one modestly bullish aspect being that the SPY tested and bounced up from its 50 Day EMA for the second time this week. The market is still struggling to keep moving up escpecially the S&P 500 and the DOW as can be seen in chart set seven where they are still clinging to the lower line of their uphill channels. The TLT bond ETF has been consolidating sideways for a week now. The NASDAQ has some fairly serious selling today but did bounce in the afternoon from its lower blue channel line which can be seen in chart seven also. The S&P and DOW are being worked down into a corner at the intersection of their downhill red channels and uphill blue channels which will force them to pick a direction within a couple of days anyway. The bond and dollar bulls still refuse to sell any farther down on their charts as they as well as other traders can see how intensely the stock market is being propped up intraday. The VIX chart in set seven shows it reached resistance at the center line of its horizontal channel today which could help the market tomorrow. With the S&P, DOW, TLT, and UUP basically consolidating sideways for a week now it's likely to be up to the NASDAQ to determine overall market direction. It has dropped considerably since yesterday's high but maybe it can bounce from its lower blue channel line that it tested intraday today and pop back up into its midyear black line horizontal channel and also its July red channel which if it could would break the DOW and S&P out of their consolidation mode and up into their respective red line channels, all can be seen in chart set seven. We will have to see.
Alan
Please see risk disclaimer below