
Stock Market Technical Analysis Blog


Click on above images to enlarge
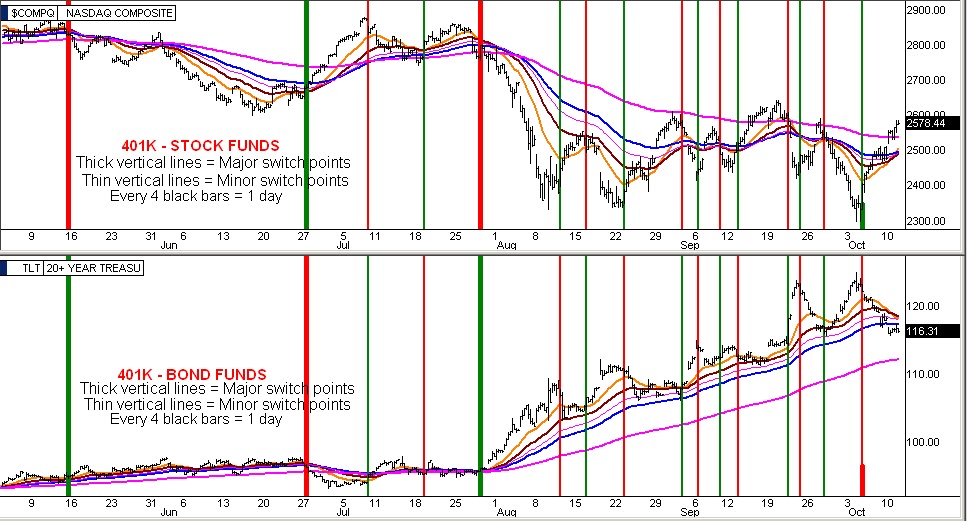
In the markets we are currently having a divergence between the inverse relationship of the stock market vs the bond market. Looking at the top chart set, the NASDAQ has climbed quite a bit in the past six two-hour bars since yesterday morning while directly below it the TLT bond chart shows that the bonds have actually traded sideways and slightly upwards since yesterday's market open. This slightly uphill channel of the bonds can be seen quite clearly in the second chart set as the bonds are actually trying to break upwards from its 5-day downhill channel when the inverse relationship would dictate that the bonds should be in the downhill channel from yesterday's open instead of an uphill channel. This unusual divergence can be interpreted as the bond bulls are simply not willing to start selling off their 10-week position trade just yet. The reason why can be seen back in the first chart set looking at the lower half (TLT) where the gold 5 EMA line has crossed down thru the brown 10 but is immediately finding support on the thin pink line 15 EMA which I added on to this set today for illustration. Usually the 15 EMA is farther away from the 10 EMA causing tremendous selling on the 5/10 downcross but since it is right up underneath the 10 the bond bulls are hanging tight to see if they can turn it back up with the 5/15 bounce instead. This is a pausible strategy for the bond bulls because of what's going on in the SPY today.
In the fifth chart set, the SPY has found resistance at the upper line of its 6-week red downhill channel which has given pause to everyone right now. Also looking at the seventh chart set, the S&P 500 index has hit resistance at the underside of its blue line uphill channel it traded in from 8/8 to 9/19. In that same chart set, the UUP dollar index has found support at the lower line of its 6 month black line uphill channel and just below that chart the VIX has fallen out of its red uphill channel down basically the same amount as it did back in mid September where it reversed back upwards.
All these things put together, the bond holders don't feel comfortable liquidating their holdings yet when they are actually still in the safest place to be in light of the current world economic picture. However looking at that same seventh chart set, the NASDAQ keeps on climbing even though the TLT is actually trending upwards.
These rare divergences of the inverse relationship between the stocks and bonds produce great tension and typically cause trading volume to fall to anemic levels as everyone knows that this divergence won't last for long. Soon either the bond bulls or stock bulls will decisively win over the other and now that the stock bulls can see that the bond bulls are not giving up their positions it is causing the stock rally to come to a standstill.
One other notatble item in these 8 chart sets can be found in chart set 6, the Advance Decline charts. The pink moving average line shown in both charts is the definitive intraday rally or sell off divider line. When we are below the pink line the stock market is in sell mode and when we are above it the stock market is in rallying mode. While they did a superb job of letting the grossly overextended plus 5k number at yesterday's close drop down to minus 3300 at the open without hardly causing any negative blip in the stock indexes, the Advance Decline climbed this morning from being too overstretched from the pink line but when it got up to it midday it was turned back down shifting the stock market back into sell mode. This is a red flag for stocks intraday.
At the moment of this posting, the 1 1/2 day bonds uphill channel is weighing heavily on stocks. If a selloff begins this afternoon in the stocks it will cause a 5 /15 EMA bounce lift to start in the bonds whereby the gold 5 EMA line could start lifting from the pink 15 EMA that we see in the first chart set, chart 2.
In summary the market may get stuck sideways here for a bit. I mentioned last night that I wanted to see confirmation of the TLT bond funds 5/10 downcross in the market this morning but I have been following a long list of breadth indicators along with gaging the activity in the UUP dollar and the VIX and I still do not believe it is yet time to post the thick line major bonds sell signal onto the first chart set. We have a long list of technical divergences and conundrums intraday today and they will just need to be worked out through the afternoon to get any clarity as to whether the bond bulls can pull off a 5/15 EMA line bounce to save their 10-week position trade.
Hopefully by the bell we will get some resolve of this stock / bond inverse relationship divergence that is occuring today.
Alan
Please see risk disclaimer below