Stock Market Technical Analysis
Click on above images to enlarge
This morning the stock market gapped down modestly temporarily producing an obvious short term overextension of the TLT (bond index) shown in the lower chart of the first chart set. This gave us a short rally this morning as this overextension was pulled back some but through midday the bonds and the dollar turned back upward again causing the stock market to roll back over. A lot of people are trying to play an oversold condition on the stock market but that really is not the place to focus, it is all about how overbought and overextended the TLT (bond index) is and that is what traders are really keying off of to allow these intermittent stock market rallies. For anyone to focus soley on the stock market and trying to determine when it is oversold can be a dangerous game. The stock market will have rallies when and only when overbought and overextensions in the bond market allows them to happen as was seen today.
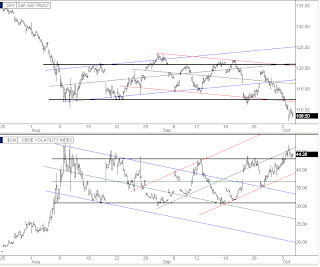
In the lower chart set, the bottom chart is a big picture look at the NASDAQ, UUP (dollar index), and the VIX (volatility index) showing the precarious situation upon us. If the NASDAQ convincingly loses the red support line I have drawn in it could cause a major upside push in the VIX and UUP charts as they have recently regained their longterm mother channels. This market is likely to continue to be an hour to hour situation at least for now.
Alan


