Stock Market Technical Analysis Blog
click on image to enlarge
In the above chart set the NASDAQ pulled back this morning after a seven day run up and is now testing the light gray horizontal line we broke above yesterday for support to move higher. In the lower half, the bond traders are using this pullback opportunity to move the bonds as high as possible quickly hoping to possibly salvage a 5 /20 EMA bounce shown with the gold and blue lines.
click on image to enlarge
In the above chart set, the stocks are also holding Tuesday's resistance line as support this morning as the bonds couldn't quite make it up to their horizontal channel from Tuesday.
click on image to enlarge
In the above chart set the NASDAQ is still in the upper half of its blue line channel as the SPY dropped back out of its blue line channel and the DOW is currently sitting right on the lower line of its blue line channel.
click on image to enlarge
In the above chart set the dollar, bonds, and VIX all popped up at today's opening and are now going sideways.
click on image to enlarge
In the above chart set the QQQ set down on the top line of its 10-week horizontal black line channel and is finding support poised to push upward from it. In the middle chart, I converted the 50 Day EMA down to this time view to illustrate how the SPY has come back down to its 50 EMA and holding tight there for support. The VIX's pop this morning put it barely back up in its 10-week horizontal black line channel but is now drifting slightly downward.
click on image to enlarge
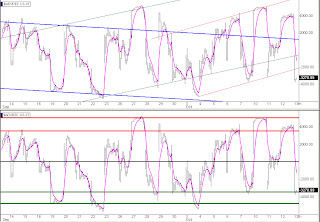
In the above chart, in the lower half the Advance Decline has reset itself back down to the green line stock market buy area and it's starting to lift.
click on image to enlarge
In the above charts the NASDAQ hit resistance at the lower line of its horiztonal April thru July black line channel but is starting to move up now after gapping down some. The S&P lost its breakout above the pink trendline so it is the chart to watch in this set for a recovery above it. The DOW is sitting fine as it simply sat back down on the lower line of its August uphill blue channel. The TLT bonds after dropping out of its blue line channel yesterday has now moved up and is sitting at the lower blue line. The UUP while moving up this morning has stopped at the underside of its 10-week uphill black line channel, the most bullish chart right now for the stock market as if it cannot get back into that channel the stock market rally will resume quickly. The VIX popped back out of its less aggressive black line channel this morning but has eased back off to where it is sitting right at that upper line right now.
click on image to enlarge
In the above chart the 5/10, 5/15, and 5/20 reset setups on the quarterly and monthly bar charts of the indexes where they are showing their intentions to move this market higher heading into the year end.
Alan
Please see risk disclaimer below


